The pandemic has been one of the most scarring periods in living memory. Through this unfortunate devastation, if there is one key takeaway, it is that hope begins at home. More than ever before, a home is not just a physical space, it is a feeling. A home is sacred. It is where the strongest human bonds are created. The pandemic has taught us that the three phases of a fulfilling life – learning, earning, and returning can be done from home.
–Chairman’s Letter – HDFC Limited AR 2021
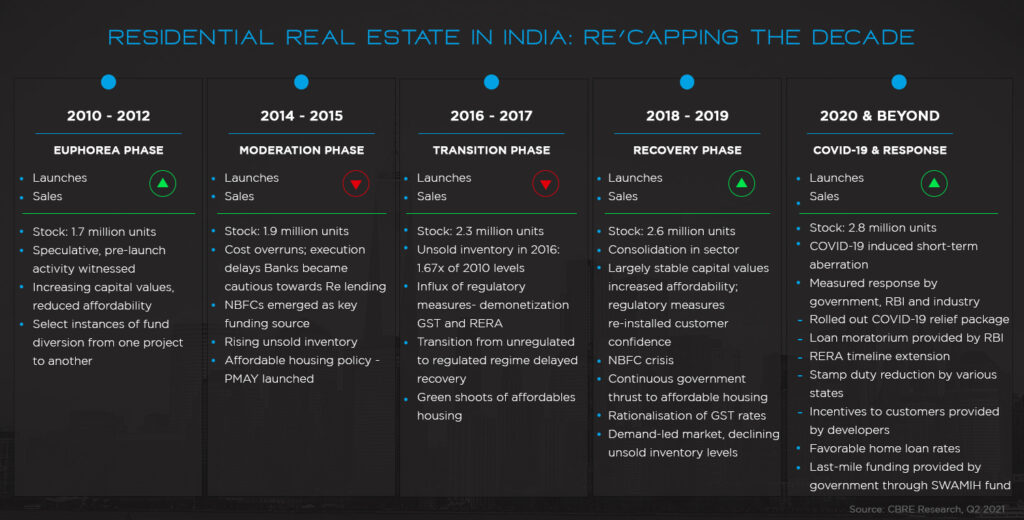
Indian real estate had a massive upcycle in the 2000s which lasted for almost a decade. The next steps were predictable, greedy developers leveraged themselves and launched more than the market could absorb. The massive supply combined with lack of transparency resulted in a lot of pain not only for the developers but also for the economy, banks as well as consumers.
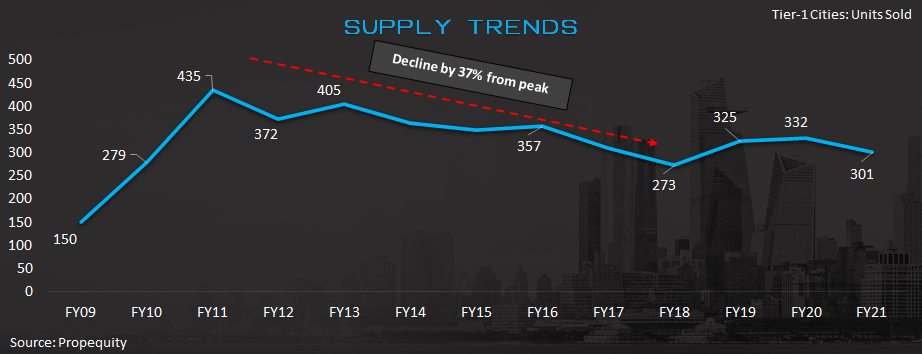
Apart from correcting the excesses of earlier cycle, real estate players had to deal with extenuating circumstances like implementation of demonetization, GST, NBFC crisis and acclimatization of a new regulatory in the form of RERA & finally the decade ended with Covid linked disruption. Sales which peaked at ~4.35 lac units have stabilized around 3 lac units p.a. for last few years.
Prediction is difficult. Particularly when it involves the future – Mark Twain
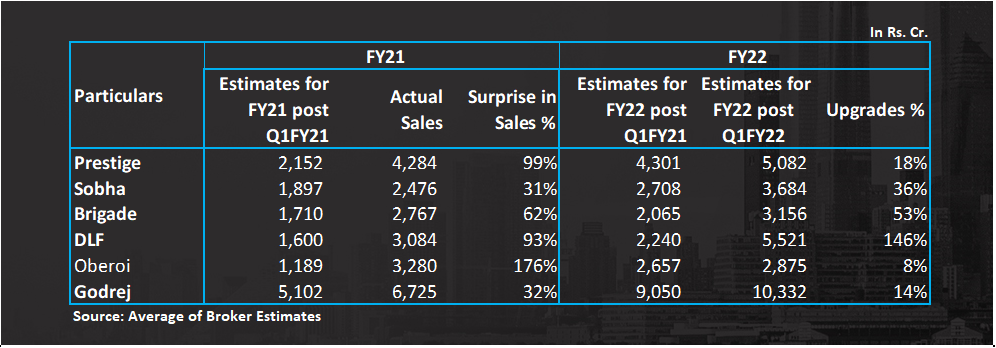
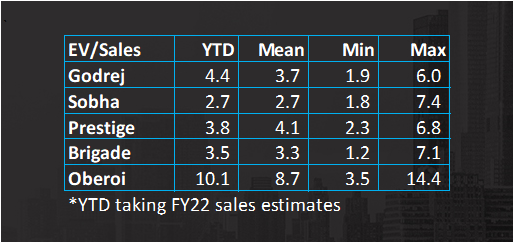
When covid struck, the discussion was centered around how real estate will be worst affected – job losses, restrictions on construction, worker migration, high ticket purchases will be postponed, etc. Last one year however has turned out to be anything but that. Aided by a variety of factors which we try to analyze in this blog, real estate demand has surprised everyone. This has especially benefited large organized players. Footfalls have improved materially and transactions are happening at a brisk pace. And the segment that has surprised the most is the luxury segment. Take for example DLF’s super luxury project – Camellias. In the last 4 years, they were selling on an average 10 units, which has jumped to 36 units in FY21. The extent of surprise in demand is demonstrated in how analyst estimates for FY21 and FY22 has moved.
Sceptics initially believed this was just pent up demand but the sentiment is slowly turning more optimistic. Foundation has been laid for a sustained revival of residential real estate.
Recent numbers from Mumbai registration data for Aug- 2021 (first month after stamp duty was reinstated to 5%) reflects strong demand momentum. The month of August witnessed property registration of 6,784 units for Mumbai City, ~16% higher than 5,873 units registered in Aug-2019 and 2.5x of Aug-2020 sales of 2,642 units. (Source: Knight Frank).
Interesting points from Consumer Survey by Anarock
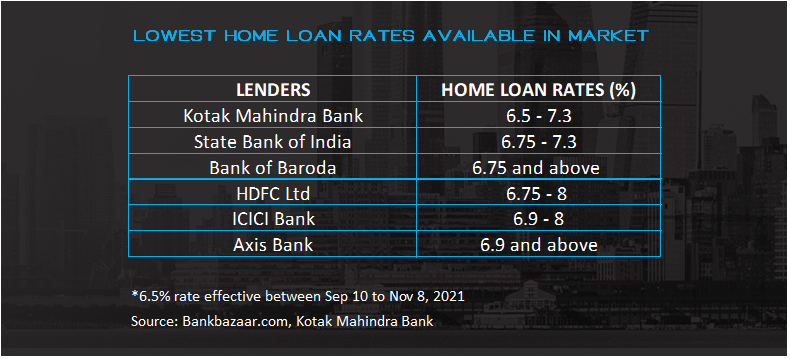
– Pricing and developer credibility are the two most important factors while buying a property followed by design and location. – Prevailing lowest-best home loan rates has been a major factor driving home property sales despite the pandemic. – 71% property seekers are looking to buy for self-use vs 59% pre-Covid period. – 46% preferred ready-to-move-in properties pre covid which has decline to 32% post Covid. This could be led by the fact that most of the new supply is dominated by branded developers and there is limited inventory available in the ready category. – 25% looking to buy properties priced Rs.0.90 -1.15cr post covid vs 16% pre covid while 27% were looking to buy properties priced >45 lacs post Covid vs 36% pre-Covid. Affordable housing buyers have been severely hit economically by the pandemic. – 32% are looking to buy second homes while 41% are mulling over it for self-use.
Let us look at the key factors driving sector revival.
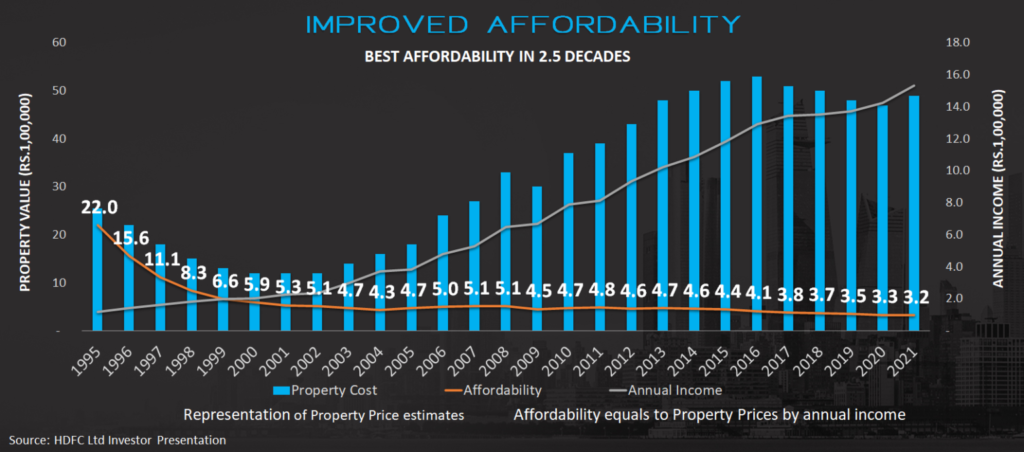
Factor#1: Affordability has never been better
For the consumers, the affordability for the middle-class customer to buy a home is good at present. Never before in my career of 14 years, there has been such an opportunity in which the interest rates were these low, the real estate price rise average has not changed in the last six years, people salaries have increased, so to buy the same home the EMI to income ratio is at an all-time low for a particular house. I see, the consumers not only buying houses but buying bigger houses and our average size is increasing. I feel, the consumer sentiment in residential real estate will continue to be positive.
– Varun Gupta CEO – Ashiana Housing
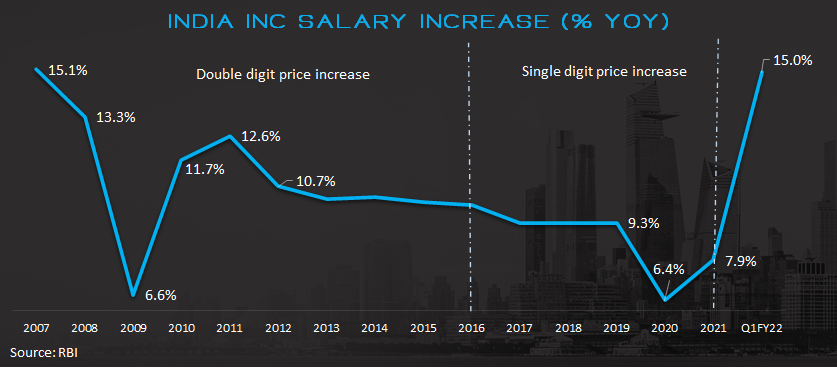
India has never seen such low interest rates…. EVER. Salary growth, decline in property prices and decline in interest rates has resulted in best affordability in three decades. Such convergence of rental yield vs interest rates must result in improved demand.
Factor #2 – Supply Consolidation
Name any industry and more likely than not you will find that the three strongest, most efficient companies control 70 to 90 percent of the market.
– Prof Jagdish Bhagwati – Rule of Three
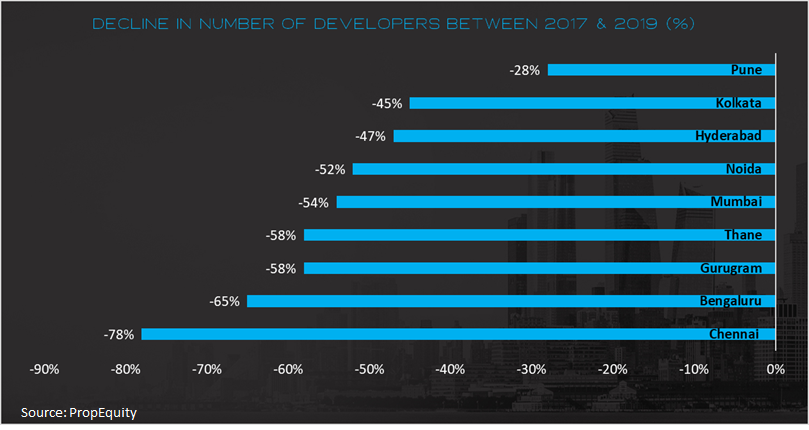
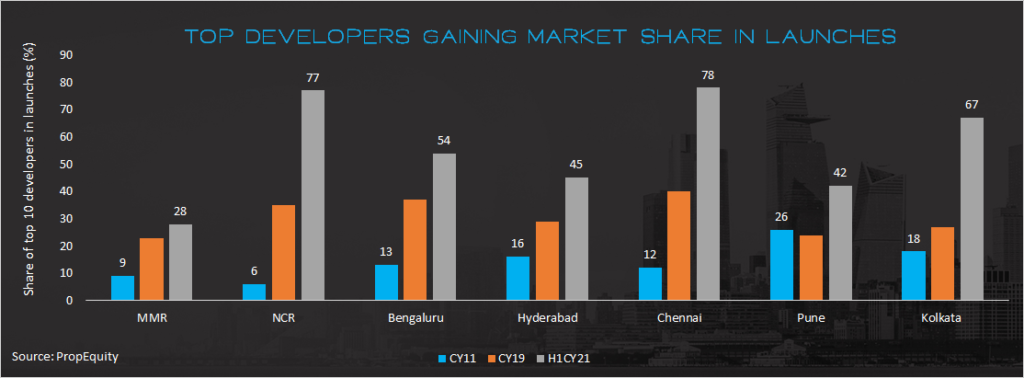
Structural reforms in the last few years started the process of weeding out smaller, unorganized developers from the market. The COVID-19 pandemic was the final nail in the coffin as it tilted the scale further in favor of established developers. The extent of supply shock can be seen from the drastic reduction in number of builders as seen from the data below.
Buyers are unwilling to take any risks and their preferences are gravitating towards recognized builders, better quality, closer to completion projects.
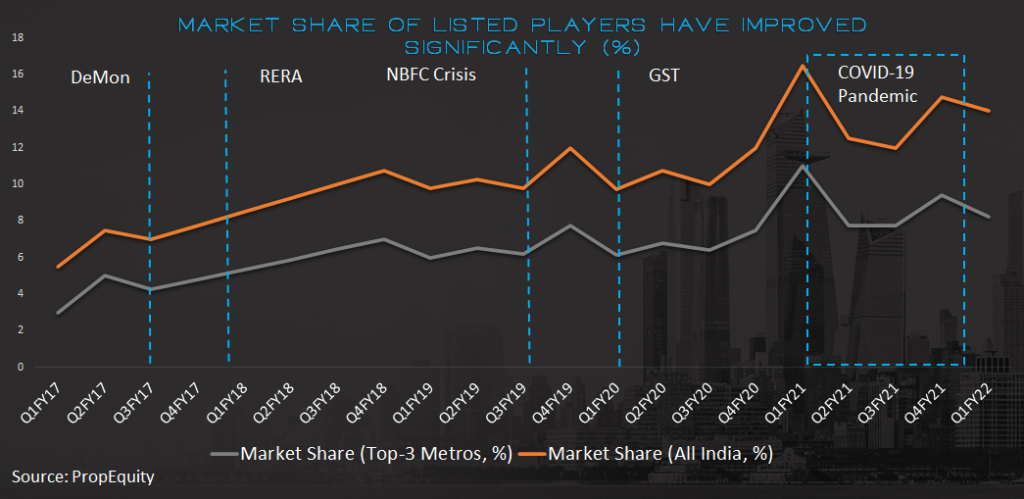
In FY21, ~25% of sales come from ready to move in (RTM) projects vs ~10% in FY13, while RTM projects comprise of just 15% of the total unsold inventory (Source: Propequity). There is an increased preference and willingness to pay a premium for projects by developers with an established track record. This tilts the balance firmly in favour of large developers who have gained substantial market share over this period of uncertainty and slowdown.’
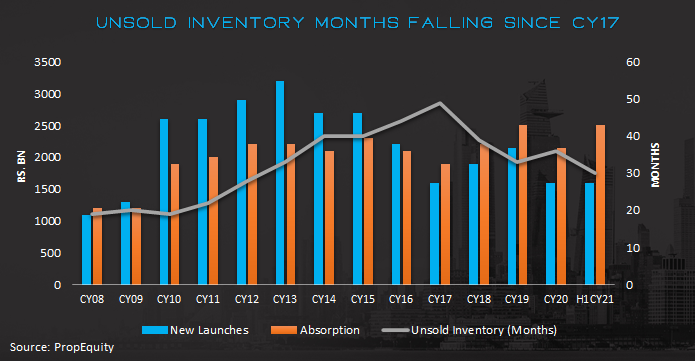
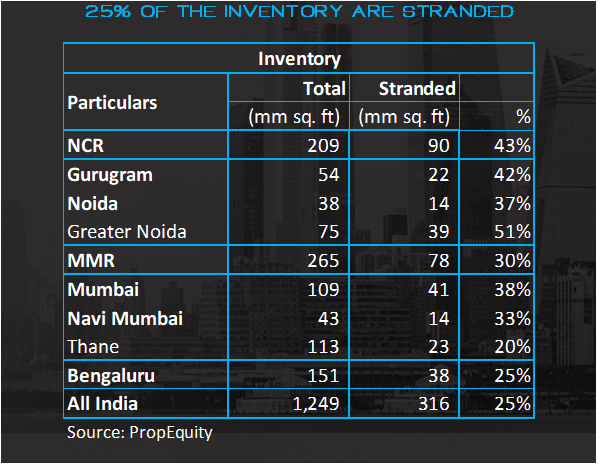
In last few years, demand has matched or even outpaced supply leading to inventory reduction. Some of this unsold inventory will remain stuck due to developer issues, hence actual inventory overhang is even lower than what is demonstrated in table below.
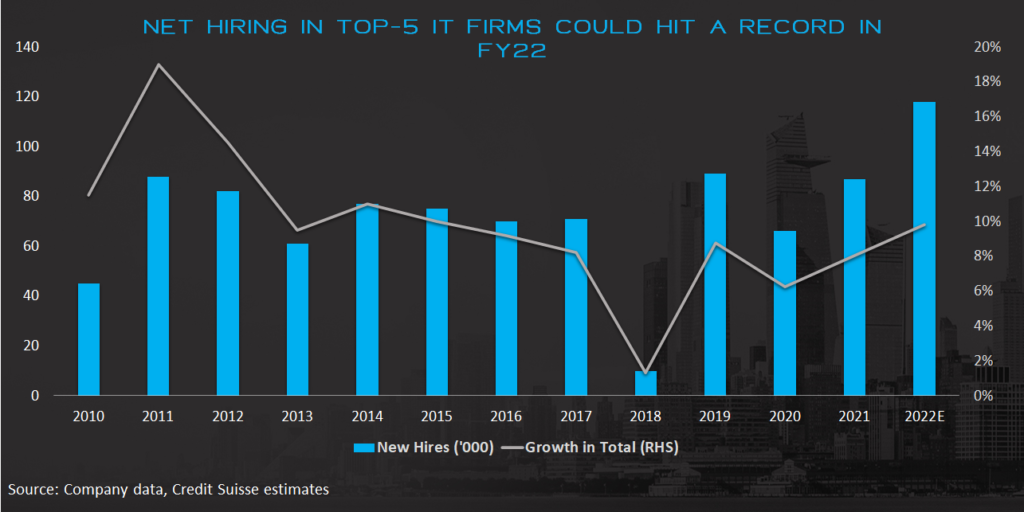
Factor #3 – Improved outlook for jobs and wages
Someone aptly commented – IT industry hiring scenario at present: “Trespassers will be recruited”
We have doubled down on increasing intake from campuses across the world as well as re-skilling our existing workforce. We will onboard 33% more freshers in FY ’22, as does the previous year. We also intend to onboard 6,000 freshers in Q2 itself. Growth is our priority, and we will ensure that talent supply is not a constraint to our ambition. In the short term, we will experience some inflationary pressure in people cost. We’ve announced a salary hike for 80% of our employees, effective September 1st, the second hike in this calendar year.
– Thierry Delaporte, CEO and MD, Wipro in Q1FY22 conference call
After initial rationalization of salaries during lockdown shock, most corporates have reinstated and even increased staff salaries. IT sector stands out. A look at the hiring commentary of IT companies clearly shows that it has been difficult for companies to retain talent and some companies have given two hikes in a year to mitigate attrition. This is also the year of unicorns with as many as 50 companies expected to become unicorns in 2021. Net hiring will hit a record this year and outlook has never been better.
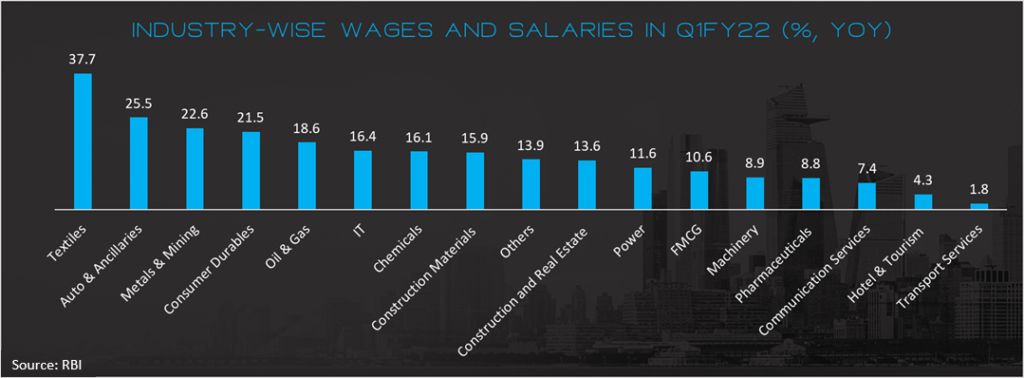
Wage hikes are not restricted to IT sector alone. Many large industries are experiencing tailwinds and are raising salaries to reward and retain talent. Albeit on a lower base, Q1 FY22 numbers demonstrate the strong hiring/ salary trend across sectors. Real Estate is expected to be a key beneficiary of this.
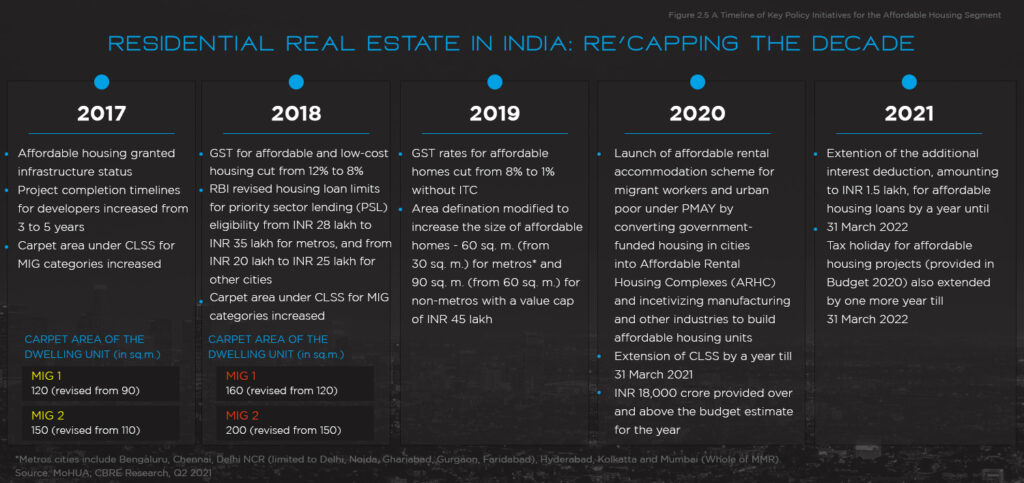
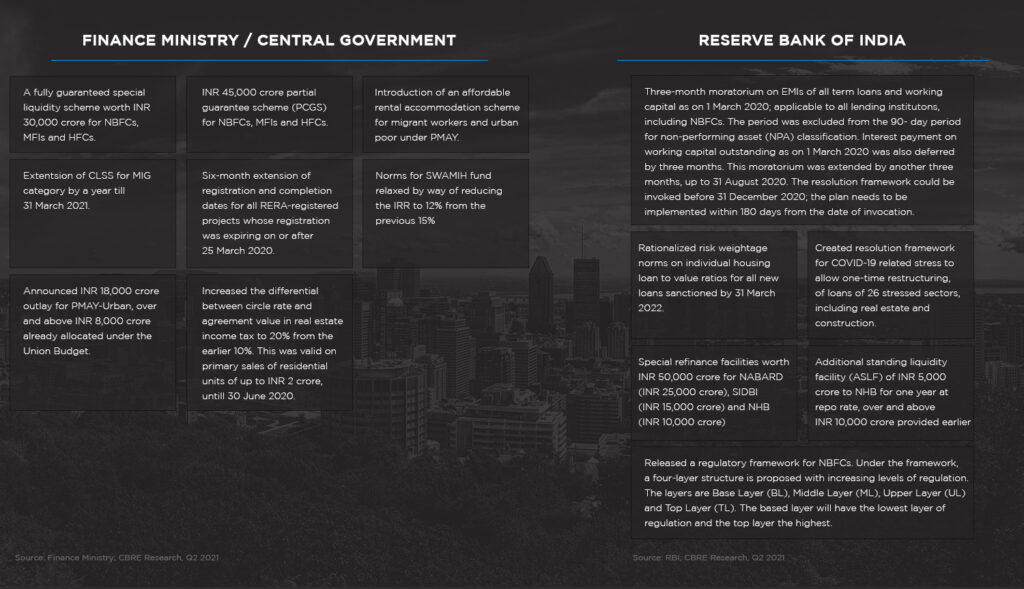
Factor #4 – Regulatory support
Anuj Puri, Chairman – ANAROCK Property Consultants in an interview in 2018 said “I think only disruption can save the day for the Indian real estate sector. Both because of the groundbreaking policy reforms now in place and the changing mind-set of real estate consumers, the old ways of doing business simply cannot prevail any longer. What is required are new ideas, new ways of conducting business, and a far greater focus on accountability and transparency than has been evidenced so far. “
Be it central government, state governments or RBI, regulatory framework for the sector has improved over the years. Over the years, there have been various steps to promote affordable housing.
Steps have been towards bringing more transparency, affordability, and funding. Recent relaxation of stamp duty added to the demand push
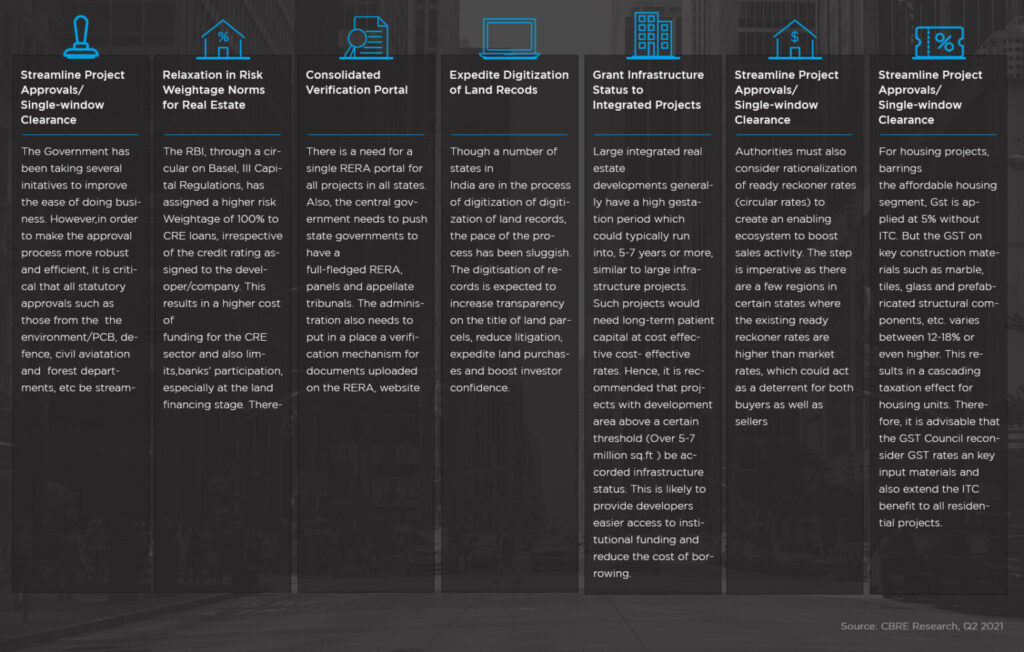
New regulatory processes encourage clean ownership, accountability, and faster execution, which augurs well for the businesses themselves and for the consumers. Here’s a bucket list of regulatory actions which, if implemented, can change the trajectory of the industry.
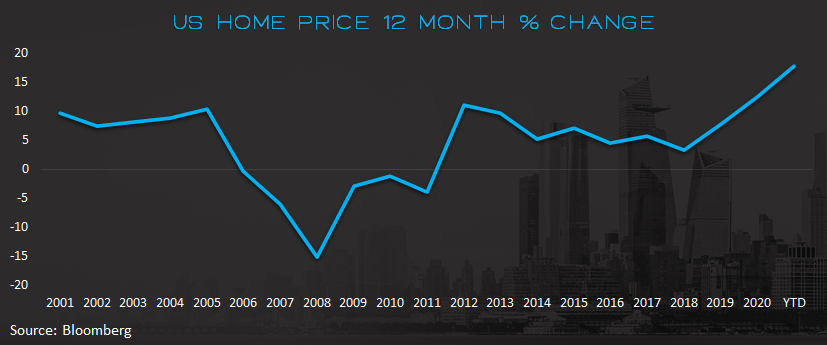
Factor #5 –Veblen Effect
“If you are a buyer, please quickly buy it because prices are likely to go up.”
The Veblen Effect is the positive impact of the price of a commodity on the quantity demanded of that commodity. It is named after American economist and sociologist Thorstein Veblen, who studied the phenomenon of conspicuous consumption in the late 19th century.
Real Estate qualifies here since the demand does increase with expectation of increase in prices. Customers are now convinced that prices will not go down further and have started to inch up. Developers understand this and have started playing to the psychology. We will see a lot more announcement of price increases by developers.
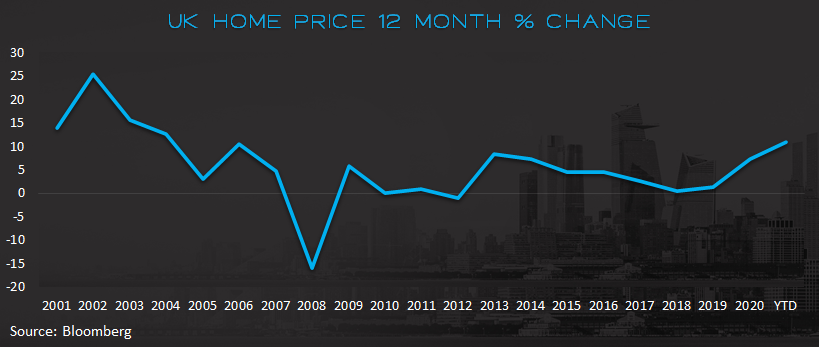
This is playing out in developed markets where the improved finances driven by stimulus has catalyzed a bull market in real estate. Price trends in US and UK are a demonstration of where the market is headed as economy improves.
Business Models have changed
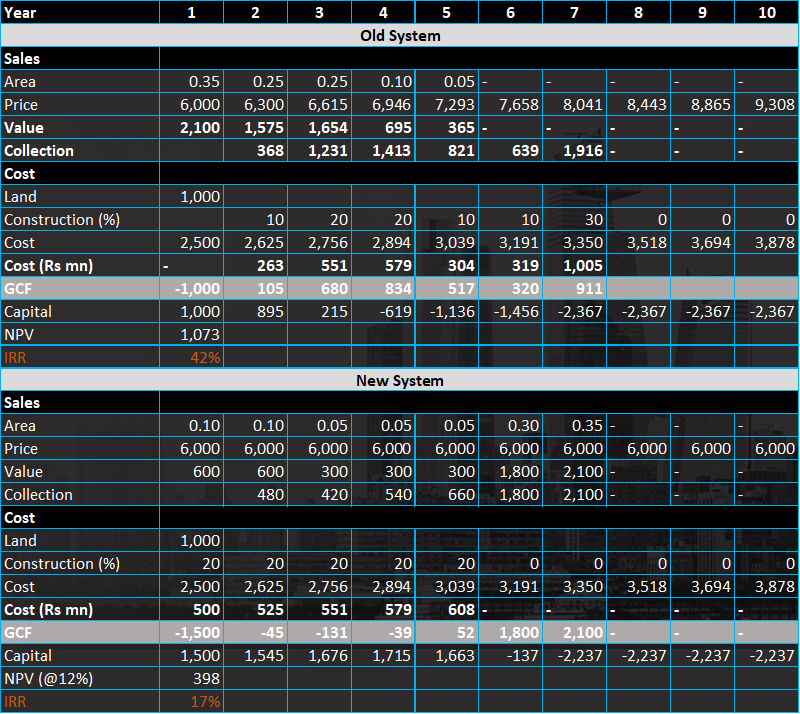
Large developers have moved away from the land banking model. In fact, developers now prefer JV/ JDA route to reduce the capital intensity for residential business. Focus is now on timely execution, quality, improving brand perception and most importantly sales velocity. Key to achieving reasonable IRR is the ability to sell the project quickly and be able to command some pricing due to quality. Focus of developers has shifted to
– Timely delivery to create brand loyalty and add-on services to build trust with customers – Accelerate adoption of modern technology and construction techniques – Embrace strong corporate governance and inculcate the ESG model – Maintain financial discipline – Diversify development portfolio; re-align portfolio with market dynamics and market cycles – Invest in upgrading labour force skill sets
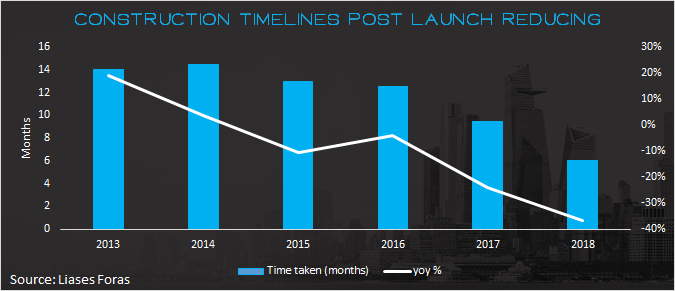
Earlier developers used to launch projects and later apply for approvals which led to elongated timelines for construction post launch. With RERA, developers can no longer launch projects without approvals and have wait for a minimum 6-12 months on an average to launch a project post purchasing a land parcel. Hence, time taken to launch a project post buying land has increased while construction timelines post launch has reduced drastically, as shown below –
Amongst many other shifts that the pandemic brought, digitization of services has been a significant one. As per reports, 60% of the entire property buying process is now being conducted online vs 39% pre-Covid period.
Anuj Puri, Chairman, ANAROCK Group says, “From property search to documentation and legal advice to down payments, homebuyers are leveraging the new tidal wave of digital technology driving the Indian housing sector. Only developers with sufficient online presence will remain relevant going forward. Also, social media are among the most effective property marketing platforms at this stage.”
For long, PropTech meant looking for property listings online instead of in the newspaper. But it is now going full-stack, offering everything from virtual reality tours and Vaastu consultations to moving services, as seen in the chart below –
Balance Sheets have strengthened
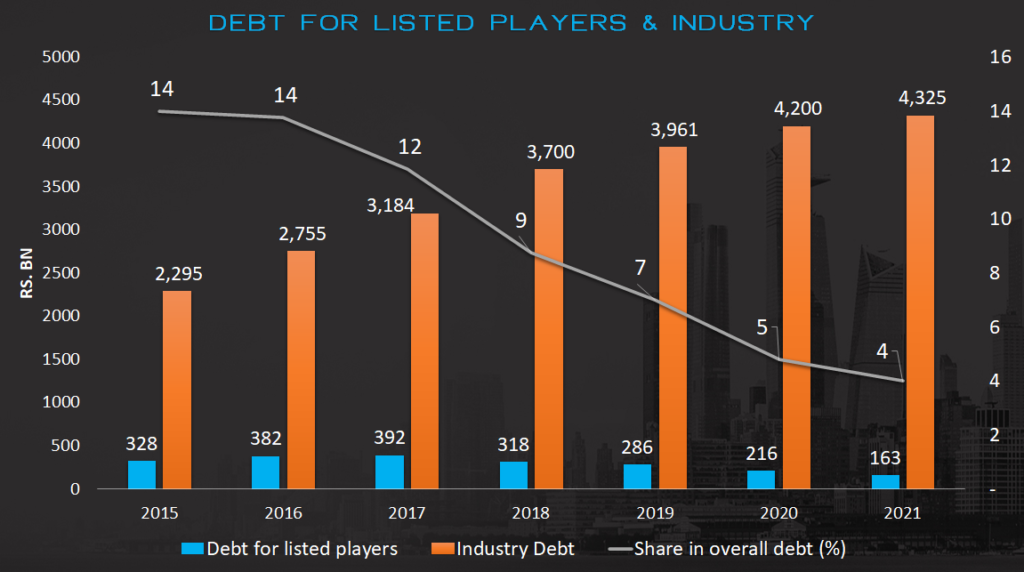
As larger developers continue to gain, the balance sheets too have seen substantial improvement over last few years which creates a virtuous environment for them in terms of cost of debt. This interest cost saving will make them even more competitive against unorganized players.
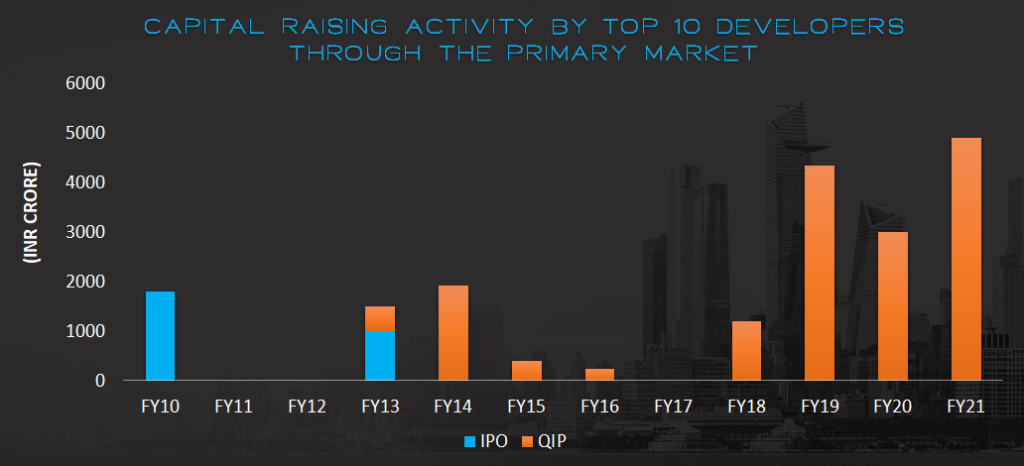
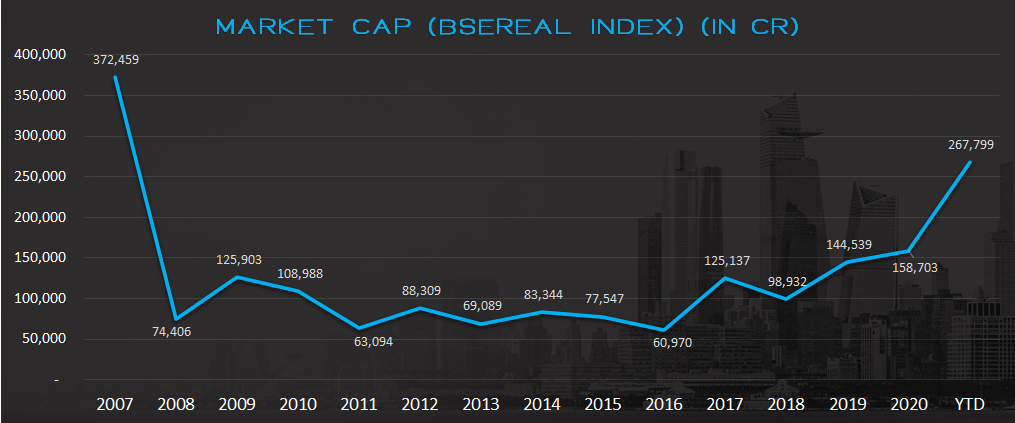
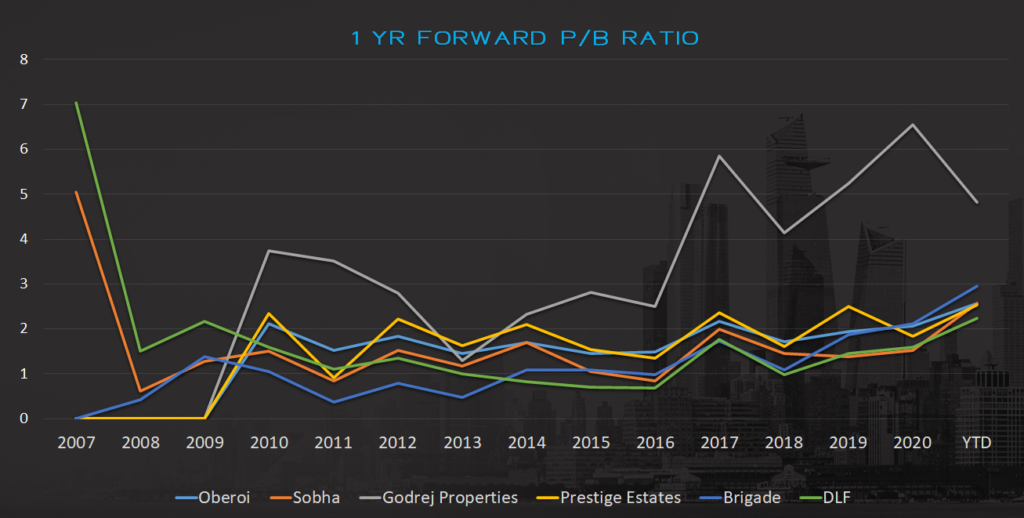
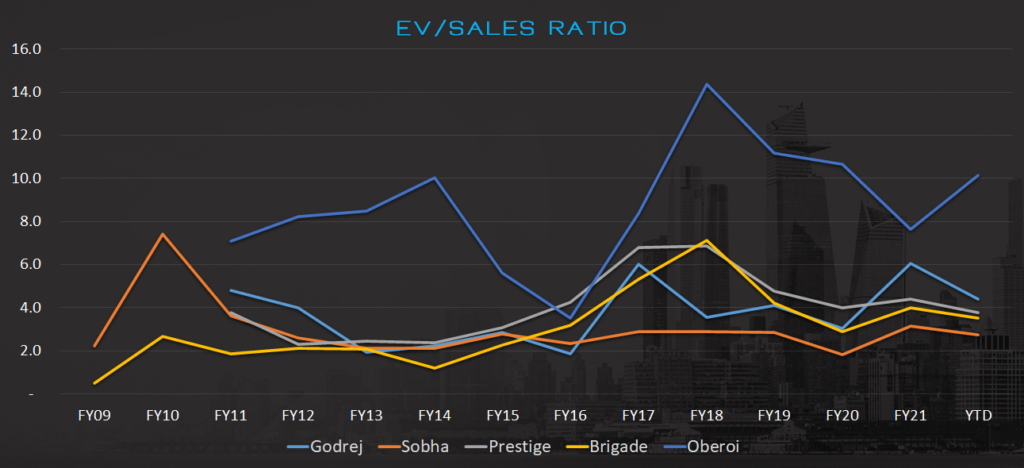
Valuations remain favourable
Compared to the importance that the sector holds for the economy, the weightage in indices and portfolios are insignificant (even after the recent rally).
YTD numbers include Macrotech Developers which was listed on 19thApril,21
Valuations have moved from throwaway to reasonable but is not anywhere close to being buoyant.
Conclusion
We may never know where we’re going, but we’d better have a good idea where we are. In assessing market cycles, knowing where we stand within them can help us tilt the odds in our favor” — Howard Marks, in his book “Mastering the Cycles”.
Clearly Real Estate Cycle is Right Ahead of us.
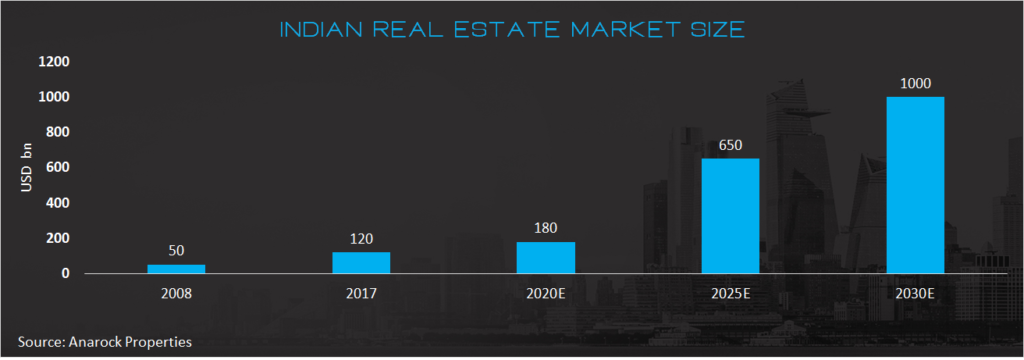
In a recent interaction, Mr. Abhishek Lodha said that he expects Macrotech to scale to 30,000 crs sales p.a. from current 7,000 crs by 2030. Some of the other data points also point out to similar optimism amongst the market participants. Industry is expected to grow from $180bn in FY20 to $1 trillion by end of this decade. This is a staggering number.
It is anticipated that the housing market is likely to attain a new peak by 2023. This optimism is reflected in the commentary about new launches by large builders.
We know that real estate cycles are long. The sector has witnessed and navigated economic slowdown, high interest rates, NBFC crisis and stricter regulations. We are now entering an exciting period of demand revival, improved regulations, transparency, and supportive macros.
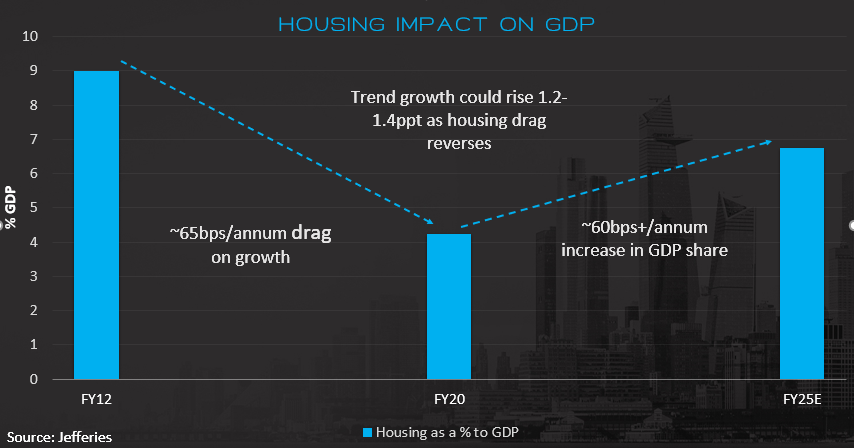
Real estate and construction industry has significant linkages (both direct and indirect) with nearly 300 sectors like cement, steel, paints, and building hardware which not only contribute to capital formation and generation of employment and income opportunities, but also catalyze and stimulate economic growth. Hence, the revival holds significant importance not only for sector but the economy as well.
This lays the foundation for a multi-year growth journey for the sector. We believe we are in the initial phase of the upcycle. Just as one swallow does not make a summer, sighting the swallow, marks the end of long winter.
Our founder & CIO, Mr Ravi Dharamshi, ValueQuest Investment Advisors, participated in the panel discussion titled ‘Art of spotting the right businesses at right times and which are the right ones for current times’ at the recently held event by PMS AIF World where top portfolio managers spoke and presented in it.
He highlights the importance the classifying the opportunities in four broad buckets :
1) Small fish in small pond 2) Small fish in large pond 3) Large fish in small pond 4) Large fish in large pond
….and how to find the strong enough boat to ride, whatever be the weather conditions !
In March 2021, Tamil Nadu Investors’ Association hosted our MD & CIO Mr. Ravi Dharamshi, who spoke about about Prince Pipes, an opportunity.
Quick Summary: – Why look at Prince pipes? Real estate is on the cusp of revival – Home Improvement is probably a better way to play Real Estate Theme – Plastic pipes is witnessing the fastest growth within Home Improvement – Accelerated Consolidation within sector helping better positioned players – Govt’s Atmanirbhar push to help domestic manufacturers – This is the most mis-priced bet in this industry
Watch the video in the link below for a more detailed presentation and view:
Disclaimer
Valuequest Investment Advisors is regulated by the Securities and Exchange Board of India as a provider of Portfolio Management Services and as an Investment Advisor.
The information provided in this video does not, and is not intended to, constitute investment advice; instead, all information, content, and materials available on this newsletter are for general informational purposes only. Information on this website may not constitute the most up-to-date information. The enclosed material is neither investment research, nor investment advice. The contents and information in this document may include inaccuracies or typographical errors and all liability with respect to actions taken or not taken based on the contents of this Newsletter are hereby expressly disclaimed. The content on this Newsletter is provided “as is;” no representations are made that the content is error-free.
No reader, user, or browser of this Newsletter should act or refrain from acting on the basis of information on this Newsletter without first seeking independent advice in that regard. Use of, and access to, this website or any of the links or resources contained within the site do not create an portfolio manager -client relationship between the reader, user, or browser and website authors, contributors and their respective employers. The views expressed at, or through, this site are those of the individual authors writing in their individual capacities only.
by Chirag Lodaya and Surbhi Soni
Executive Summary
Plastic Pipe is a highly fragmented industry with large number of unorganized players. Due to commoditized nature of the product and low capital requirement, there are optically no barriers to entry. Moreover, there is high dependence on imports as more than half of the raw-material requirement is sourced from outside India. Given this, plastic pipe industry might not seem lucrative to any first level thinker. However, our deep dive into the sector suggests otherwise and we were able to gather some differential insights about this business.
Plastic Pipe is a unique industry. It has grown at a healthy rate of 15% over the last 10 years and has been the fastest growing segment in the overall building materials space. Despite being a fragmented market, the competitive intensity in this industry is moderate. Unlike other building material categories like tiles and plywood, players in this industry compete on quality and not merely on price. In addition, there is increased consolidation benefitting larger (many of them listed) players. Despite a challenging year where global supply chains were disrupted, large players demonstrated agility and emerged stronger.
Two parts to our deep dive into Plastic Pipe sector to understand “Dhanda kaisa hai?”
1. Dhanda Kaise hota hai?
Evaluating various aspects such as raw-material sourcing, manufacturing process, distribution chain and unit economics of pipes and fittings.
2. Dhande mein kya ho raha hai?
Evaluating current trends and developments – imposition of ADD on CPVC resin, buzz around Jal-Jeevan Mission (hype or real potential) and most importantly what really is driving consolidation in the sector.
We believe the sector has long-term tailwinds and will have big winners. Our findings reinforce our bullish view on the sector.
DEEP DIVE INTO THE PLASTIC PIPE INDUSTRY
The plastic pipe industry has seen unprecedented PVC price rise due to disruption of global supply chains, container shortages and declaration of force-majeure by large resin manufacturers. PVC prices have more than doubled and continue northward. Unorganized players faced both availability and working capital constraints. This led to market share gains for organized players. With the buzz around real estate revival, government infrastructure push, and exit of some players, prospects for the industry look bright which is reflecting in a near-term strong performance by listed players.
In this note, we deep dive into the sector to get answers to two basic questions:
– Dhanda kaise hota hai? – Dhande mein kya ho raha hai?
Let’s start with the basics.
DHANDA KAISE HOTA HAI?
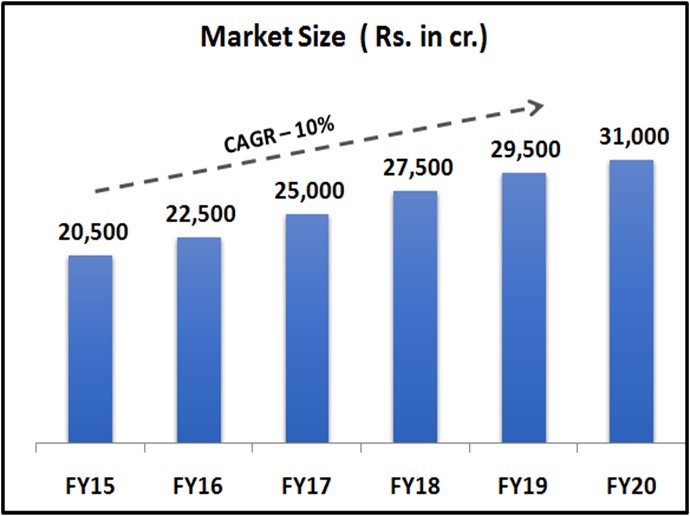
Plastic pipe industry in India
Source: Industry Reports
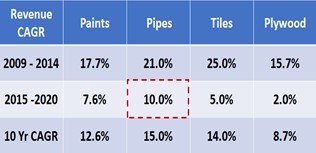
Plastic pipe is ~Rs. 31,000 cr. industry in India which has clocked a healthy growth rate of 15% over the last 10 years. As demonstrated above, it has outpaced other building material categories like tiles, paints and plywood and has been the fastest growing sector in the domestic building material space.
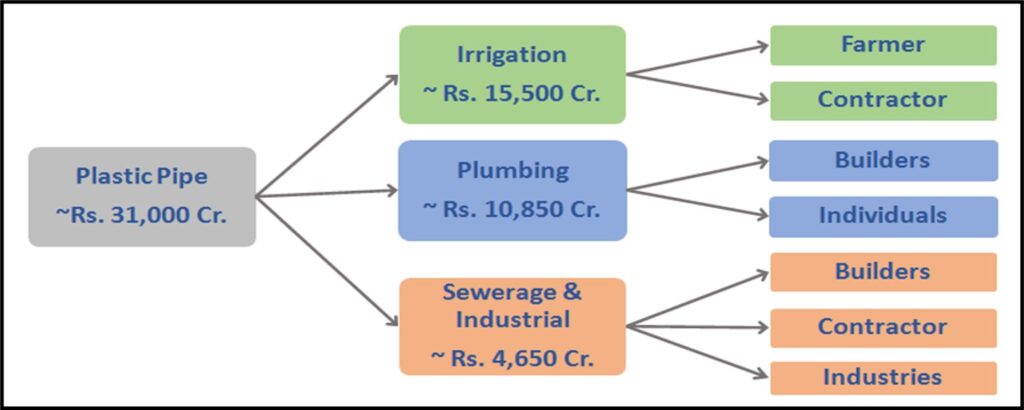
END-USER MIX
Source: Industry Reports

The growth in plastic pipe industry is led by multiple demand drivers. Irrigation accounts for highest share of the demand (~50%) followed by plumbing which accounts for ~35% of the total demand. Revival of real-estate sector and increased government focus on infrastructure development is likely to drive up demand from the plumbing segment. Other segments include sewerage which accounts for ~11-12% of the demand and the remaining ~3-4% of the demand comes from industrial applications.
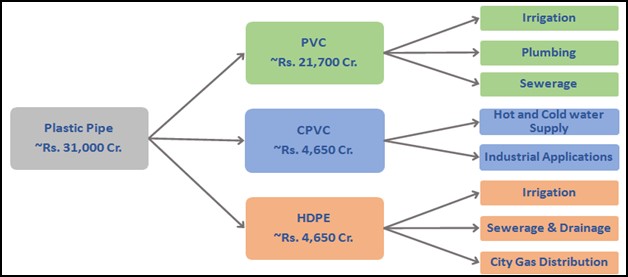
Source: Industry Reports

There are three main types of plastic pipes – PVC, CPVC and HDPE.

Polyvinyl Chloride (PVC) – PVC is the most commonly used polymer type and accounts for ~70% of the demand.

Chlorinated Polyvinyl Chloride (CPVC) – CPVC pipes are produced by chlorination of PVC resin. CPVC pipes can withstand higher temperature than standard PVC pipes and hence are suitable for hot and cold water application.

High Density Polyethylene (HDPE) – HDPE Pipes are softer and more flexible pipes. HDPE is more suitable for fluid and gas transportation.

DWC (Double Wall Corrugated) – DWC pipes are similar to HDPE pipes and are fast replacing traditional metal and cement pipes (RCC) due to longer life and low-maintenance requirement. DWC pipes are mainly used for underground drainage system in government and infrastructure projects. Amongst large players, Supreme Industries was the first company to put up DWC capacity in 2016. Prince Pipes added capacities of DWC in 2018 and in the same year, Astral also added the capacity by acquiring a private company – Rex Polyextrusion.
MANUFACTURING – PROCESS OF PIPES & FITTINGS
Process of manufacturing pipe is known as Extrusion. In this process, the PVC compound is fed into the hopper of an extruder machine where the compound is melted at high temperature and pressure. The molten plastic is passed through a die which provides a specific profile to it which is then cooled in a vacuum controlled water tank. The pipe is then pulled through a roller and cut into the desired length.
Fittings are specialized products that help in the installation of pipes. The process of making fittings is almost similar to that of pipe except that the molten plastic is fed into a mould where it is cooled and solidified into the shape of the mould.
COMPETITIVE LANDSCAPE
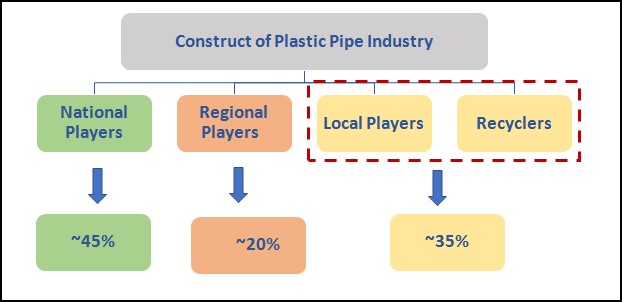
Source: VQ

Domestic plastic pipe is a fragmented market with National Players, Regional Players and Local Players/ Recyclers. If we look at the construct of the industry, ~ 45% of the market lies with the top 6 national players. The next 20% of the market lies with ~15-20 dominant regional players and the rest~35% of the market lies with smaller unorganized players who are either local manufacturers or mere recyclers.
KEY PLAYERS IN THE INDUSTRY
National players
Regional players
(This is an illustrative list of the some of the dominant regional players)
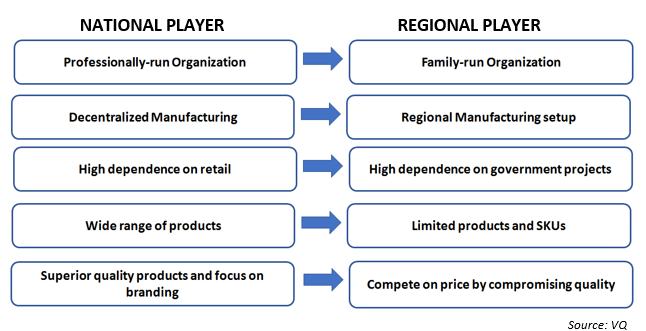
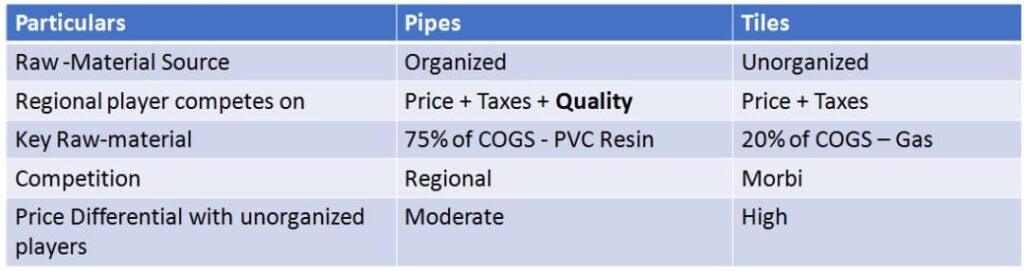
COMPARISON BETWEEN NATIONAL AND REGIONAL PLAYER
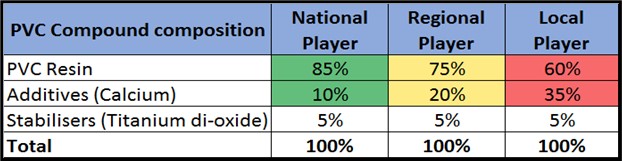
There are large number of local players and recyclers who account for ~35% of the total market. Our channel checks suggest that local players can charge much lower than national players by compromising on quality and cutting their manufacturing cost; Here’s how.
PVC compound which is 70-75% of COGS consists of resin, additives (calcium) and stabilizers (titanium di-oxide) which are required to be mixed in prescribed proportion to manufacture a pipe of a standard quality (Ideal proportion being 85:10:5). Additive (calcium) is 1/10th of resin cost. Local players manipulate the mix of PVC compound (60:35:5) to achieve low manufacturing cost.
However, they are not direct competition to large players. Pipes have a long replacement cycle and cost of replacement is extremely high as well. In other building material categories such as tiles and plywood, smaller players are competitive in terms of quality. In case of pipes, there is a noteworthy difference in quality and there is a brand value in the minds of consumers.
For example – For a pipe having weight of 750 gm, the price differential amongst the national players is insignificant to influence the purchase decision of a consumer as pipe is a small % of the total project cost. On the other hand, though a local player/recycler can offer the cheapest price but that comes at the cost of quality (500 gm vs 750gm) which is not acceptable. Hence, a price conscious customer may compromise a bit on quality (700 vs 750 gm) and shift to a regional player, but it is highly unlikely that he would move to a local player/recycler irrespective of how cheap the price is.
This means that due to significant difference in pricing as well as quality, by offering cheaper price local players do not pose any threat to national players. Hence, in our view the competition for a national player is restricted to another national player or a dominant regional player.
RAW – MATERIAL SOURCING
Raw-material for plastic pipe i.e., PVC resin and additives together account ~70-75% of the total COGS. In India, ~ 56% of the total demand of PVC resin is met through imports. There are limited domestic resin suppliers. One of the largest domestic resin suppliers is Reliance.
Large players have sourcing advantages as demonstrated below:
Unlike large players who enjoy 4-8% discount by procuring resin from Reliance or by directly importing from international resin manufacturers, small players procure resin from importers or distributors by paying a premium of 2-3%. Due to this, large players enjoy a cost advantage of 6-11% over small players. Small / regional players try to eliminate this differential by manipulating the mix of PVC compound!
As per our channel checks the recent rally in PVC prices has led to dual problems for smaller players – sourcing challenges (availability issues) and increased premium (north of 10%). Several players are facing existential crises.
UNIT ECONOMICS
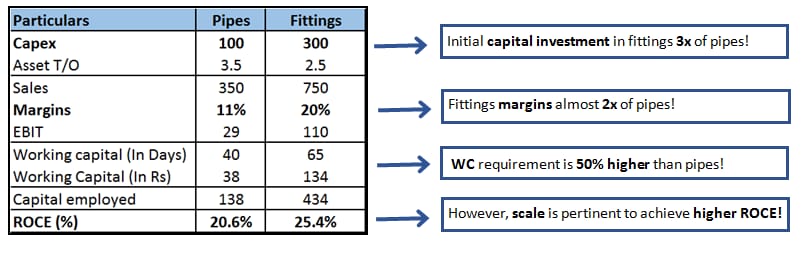
Manufacturing pipes is simple and not very capital intensive, but fittings are different. Fittings require precision and significant investment in moulds which makes it capital intensive compared to pipes (~3x of pipes). The requirement to maintain large number of SKUs also increases the working capital in fittings. On the other hand, pipe is a fast-moving product and have higher asset turns compared to fittings. However, due to its specialized nature, fittings fetch much higher margin than pipes (~2x of pipes).
To summarize, both pipes and fittings are profitable businesses. In our view, higher share of fittings differentiates a company from its competition as it helps them to sell more volumes of pipes. And, a company can also earn Higher ROCEs provided scale is achieved.
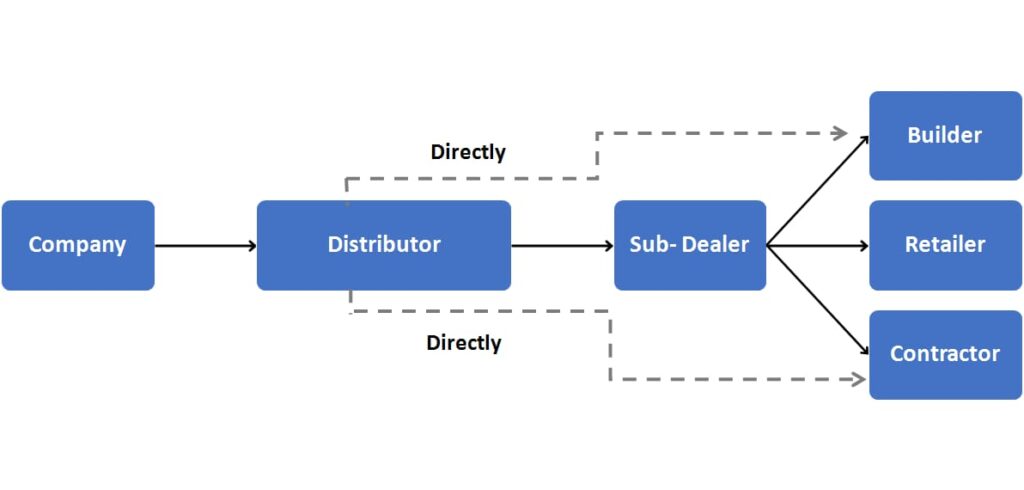
DISTRIBUTION CHAIN
The distribution chain of pipe is unique. Due to voluminous nature of the product, pipe industry follows a two-tier structure. Companies sell pipes to their exclusive distributors who either sell to a sub-dealer or directly to end customer. In the entire distribution chain, the distributor is the king. As distributors have the power to influence a consumer’s purchase decision, companies’ ability to scale depends on – 1) the distributor’s network and reach and 2) the relationship of the company with the distributor.
Note: Unlike pipes, in other building material categories like tiles, plywood, and wires, there are no company-exclusive distributors. The companies directly sell to the dealers who are also the retailers.
PIPE – A BUSINESS OF SCALE
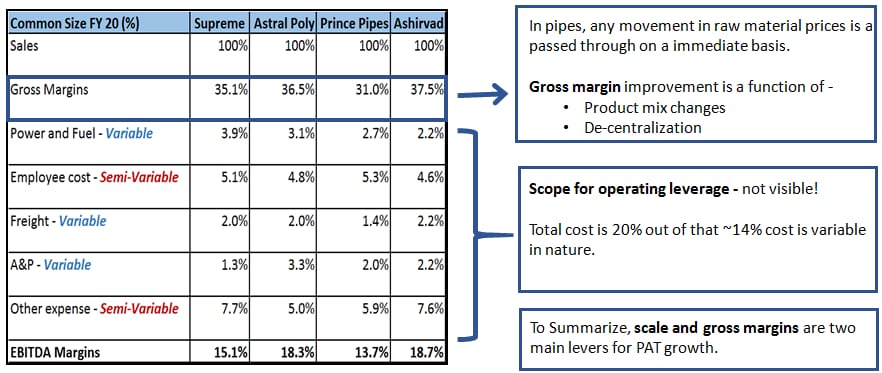
The common size analysis shows that pipe is a low value addition product as COGS itself is 65-70% of the sales. Pipe is a pass-through industry where any increase/decrease in raw-material price is passed on to the consumer on immediate basis. Also, majority of the other costs are variable/semi-variable in nature leaving marginal scope for operating leverage.
In this business scale and gross margin improvement are the only two key drivers for profitability growth. Gross margin is a function of change in product mix and manufacturing de-centralization. Let’s understand both the aspects in detail.
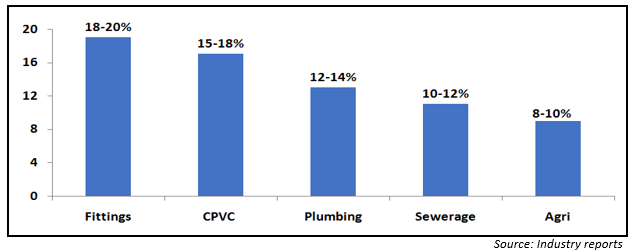
UNDERSTANDING OPERATING PROFITABILITY OF DIFFERENT SUB-SEGMENT/CATEGORIES
ndustry data suggests that there is striking difference in margins earned under each segment. Due to their specialized nature, fittings and CPVC fetch higher margins compared to other categories. Similarly, because of higher competition, companies earn lower margins in agri compared to plumbing and sewerage. Therefore, profitability of a company depends on its product profile and the segment it caters to.
HOW DECENTRALIZATION HELPS IN IMPROVING PROFITABILITY?
As pipe is a voluminous product, decentralization helps companies to reduce their freight cost and improve realization. In addition to reduced cost, strategic location improves their competitiveness with regional players and enhances their market-serviceability. We noticed that in last 5 years, large players have accelerated expansion and decentralized their business operations.
To conclude, we believe that these four attributes give a company competitive advantage over peers.
DHANDE MEIN KYA HO RAHA HAI?
ANTI- DUMPING DUTY (ADD) ON CPVC – A BOON FOR ORGANIZED PLAYERS
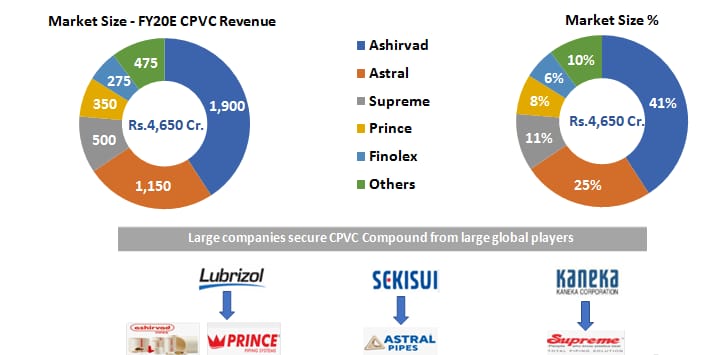
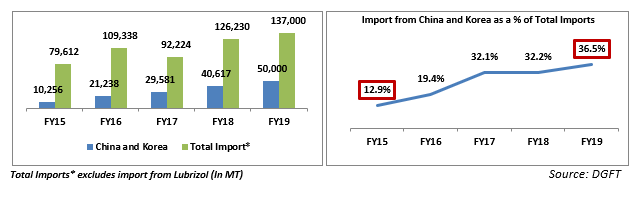
In India, CPVC is ~ Rs. 4,650 cr. market. Due to increased acceptability and application, the consumption of CPVC has gone up and it has become the fastest growing category within plastic pipes. Currently, India does not have CPVC capacities, and it meets ~95%+ of its compound requirement through imports. Large players procure CPVC compound from global manufacturers whereas China and South Korea were key source of CPVC compound for small unorganized players. Small players sourced cheaper resin from these countries and competed aggressively with large players on price. In a span of just 4 years share of imports from these countries had gone up 3 times from ~13% to 36%.
In order to curb import of cheaper compound, in February 2020, GOI imposed ADD on CPVC resin imported from China and South Korea. Due to this ~40% of imports have become unviable. This move has taken away the advantage of sourcing cheaper resin from smaller players and has made large players even more competitive.
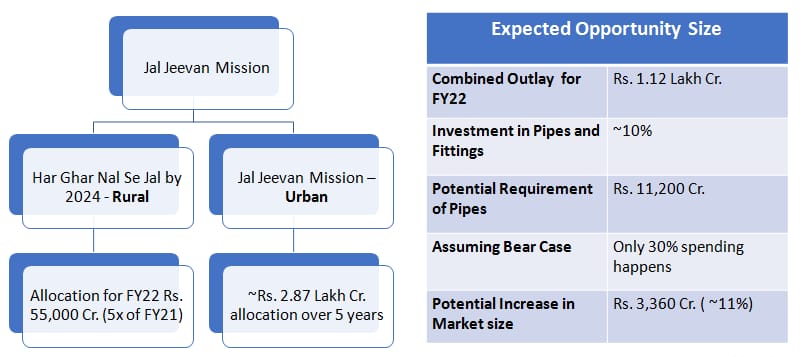
THE BUZZ AROUND JAL JEEVAN MISSION
In the Feb’21 budget, GOI merged the ongoing National Rural Drinking Water Programme (NRDWP) into Jal Jeevan Mission with an aim to provide tap connections to every rural household by 2024. What caught everyone’s attention was the massive allocation of Rs. 55,000 cr. towards this mission (5 times the allocation of FY21!!). In addition to this, the Government also announced Jal Jeevan Urban mission which aims to provide water supply through functional taps in 4,378 statutory towns and sewerage management in 500 AMRUT cities. These two missions (rural + urban) combined mean that plastic pipes worth Rs. 11,200 cr would be required. In a typical water supply project, generally HDPE and PVC pipes are required for last mile supply of water from distribution point to households. If the execution is right then undoubtedly, this creates an exciting opportunity for HDPE and PVC pipes.
Types of pipe required in a water supply projects
However, historically, government projects have attracted regional players and there has not been any active participation from any of the national players. Further, government projects have lower margins and are working capital intensive. Then, why are we even seeing so much bullishness from large players?
Because this time, it is possibly different!
Post- covid, a lot of regional players have moved out of the market as they faced severe challenges in sourcing raw material. Large players are willing to capitalize on this and they believe due to better manufacturing and distribution network, government tenders are more likely to flow to them. One of the large companies has already announced investments focused on Nal se Jal scheme, the other has talked about adding HDPE capacities. Thus, unlike past, we may see large players actively participating in the Jal Jeevan Mission.
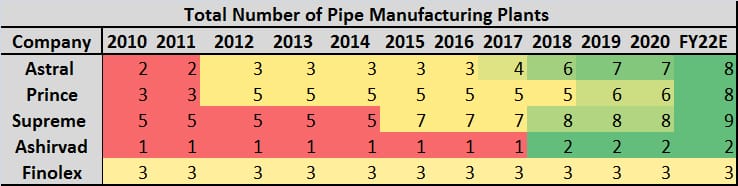
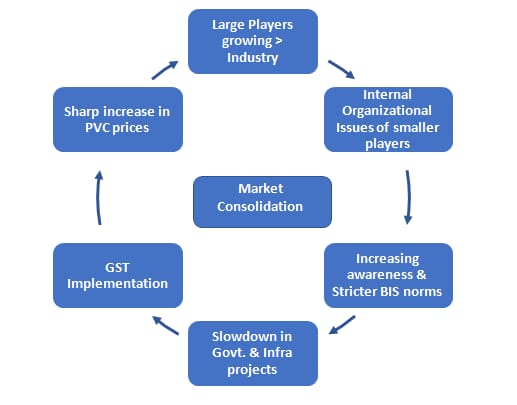
SECTOR CONSOLIDATION
There are multiple tailwinds driving industry consolidation. Last five year data clearly shows the trend.
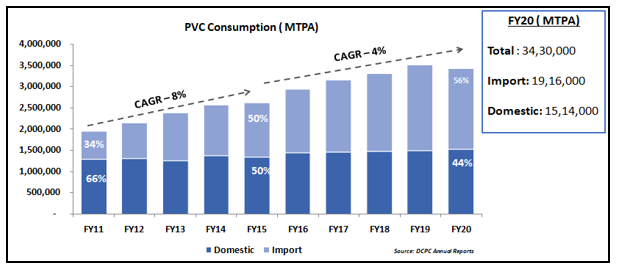
PVC CONSUMPTION – GREW AT A SLOWER PACE
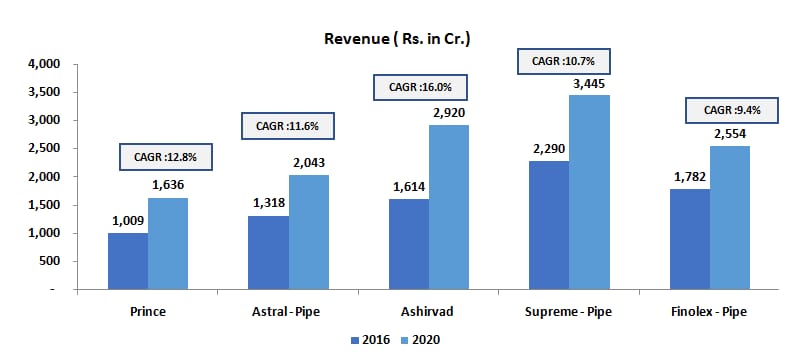
ORGANIZED PLAYERS GREW AT DOUBLE DIGIT RATE
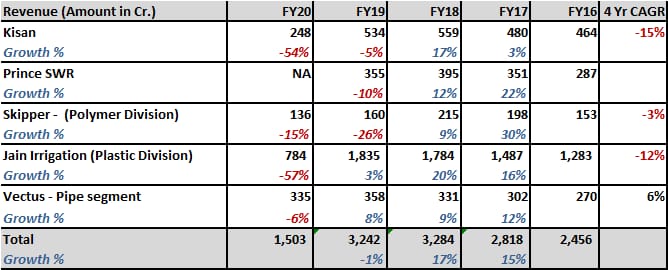
REGIONAL PLAYERS – STRUGGLED TO GROW
As can be seen above, in the last 5 years, PVC consumption in India grew at a much slower rate compared to the previous block of 5 years. During the same period, despite a slow-down in PVC consumption, large players have grown at a much healthier rate whereas small/regional players have struggled big time. This means that large players have not only surpassed the industry growth rate but have also grabbed the market share from smaller players.
This has been driven by –
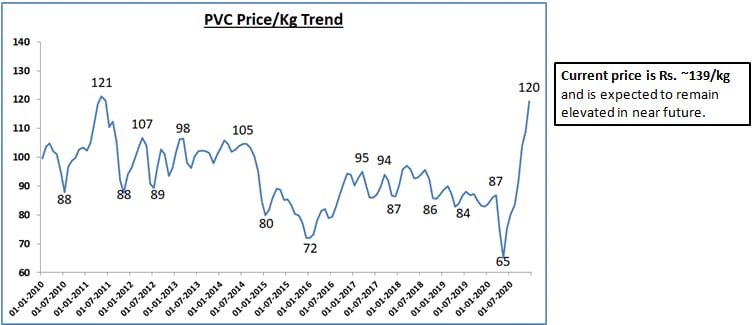
PVC prices have breached all-time highs. The recent rally in PVC prices has aggravated the struggle of small players. Sourcing challenges have moved many small players out of the market. Large players who have secure supplies have not faced any severe disruption yet and have been able to pass on the price rise.
(b) GOODS AND SERVICES TAX (GST)
The above example of comparison with tiles confirms that scope of tax evasion in pipes is far lesser than other segments like tiles given than 75% of COGS is tax paid.
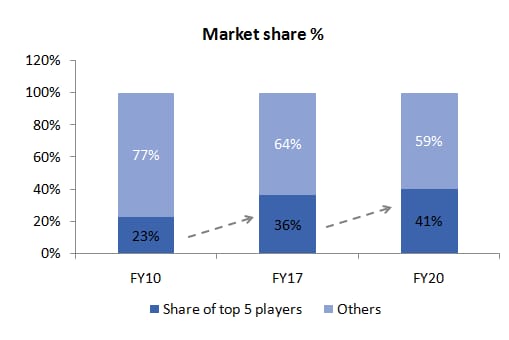
Industry data confirms the consolidation thesis. The share of top 5 players has doubled in the last 10 years.
CONCLUSION
After a comprehensive study of the industry, analysis of various aspects of the business and given the recent trends in sector it is evident that plastic pipe is the fastest growing segment in overall building material space with huge runway for growth. Industry is consolidating and larger players continue to see good times. Though it looks like a simple business at first glance, it is not easy to scale which is a key requirement for good profitability.
We believe the sector has long term tailwinds and will have big winners. Our findings reinforce our bullish view on the sector.
By Sameer Shah and Pranav Mehta
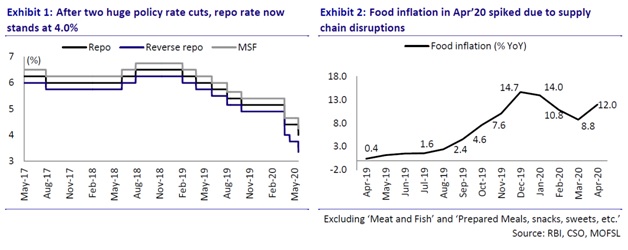
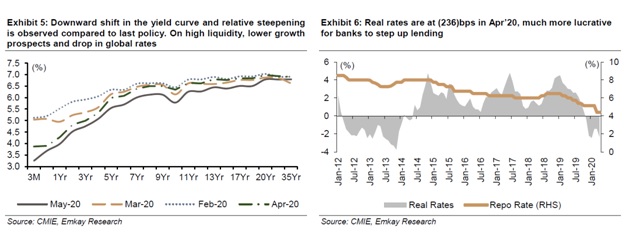
RBI has responded to Covid situation in three installments so far. A summary of our assessment of the same
1. Change in stance
RBI has clearly changed its stance under the new Governor from inflation targeting to supporting growth as well. In fact, in the recent policy announcement, they have recognized the impact on growth is far higher than anticipated due to extended lockdown and hence announced an out of turn rate cut of 40 bps.
Hence in the near term, they have allowed real interest rates to turn negative anticipating inflation to come down once supply is restored. Economists say there is a further scope of reduction in interest rates to help revive growth given the moderate inflation expectations.
In addition to this, the government has yielded by reducing interest rates on small savings which has enabled banks to reduce the deposit rates to attract deposits. However, this benefit is only available to organizations where there is no trust deficit. Other banks/ NBFCs are not seeing the bonanza of deposit growth especially post Yes Bank saga.
The obvious negative impact is on the savers who will earn less post tax (hopefully just enough to beat inflation).
Second impact can be on foreign flows who may find rates unattractive given the currency risks. There has been an outflow from domestic bonds by FPIs (in line with rest of emerging markets) and what used to be a quota allocation has moved to a situation where FPIs are now utilizing only 48% of quota.
Lastly, the intended positive effect is not visible on bond market because of reluctance of banks to reduce deposit rates earlier and fear of crowding out by the government.
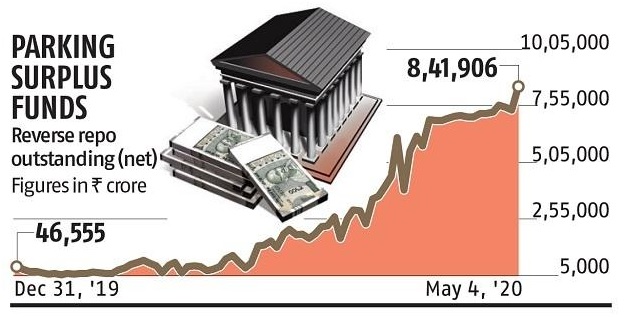
2. Liquidity measures
Cut in reverse repo to 3.35% – clearly there is more than adequate liquidity in the system, but as discussed above, banks have been reluctant to lend and have preferred to park excess liquidity with RBI. RBI on its part, has reduced reverse repo rate substantially to disincentivize this and force the banks to lend.
RBI has so far announced liquidity measures to the extent of Rs. 9.6 trillion. Governor also continued to stick to his phrase that “we would do whatever it takes” indicating that more measures will be announced if need be. Some of the significant measures include
– Reducing CRR for all banks by 100 bps – Continued OMO purchases – Liquidity measures through LTRO. Specifically introduced TLTRO in previous tranche – 50000 cr – to be given to microfinance, small and medium NBFCs – Refinancing for AIFIs – a sum of of 50000 cr available to Nabard, SIDBI and NHB to meet sectoral objectives (though time frame of 3 months and has been extended by another 3 months) – LCR requirement reduced from 100% to 80% (to be taken to 90% by Oct and 100% by Mar) – Credit line of 15000 cr to Exim for 3 months which can be rolled over for 1 year
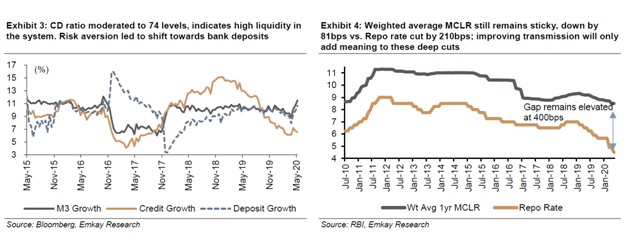
However, not all measures have yielded desired results. Banks have continued to remain risk averse
– Lower bids for TLTRO – No excitement about refinance from SIDBI etc because of low tenure – Funds parked with RBI continues to remain very high. Banks still have Rs. 7,50,000 cr parked with RBI (down from peak of Rs. 8,50,000 cr)
This has led to reduction in borrowing rates only for new borrowers and AA+ rated borrowers. Rest of the market still has a struggle to secure the borrowing lines given the banks’ risk averseness.
The 1 year median marginal cost of funds-based lending rate (MCLR) declined by 90 bps (February 2019-May 15, 2020). The weighted average lending rate (WALR) on fresh rupee loans has cumulatively declined by 114 bps since February 2019, of which 43 bps decline occurred in March 2020 alone. The WALR on outstanding rupee loans declined by 29 bps during October 2019-March 2020
3. Financial stability
Inspite of having the resources, there is a striking difference between the Fed and RBI approach where the Fed has stepped in directly and is using its own balance sheet to ensure financial stability and is also supporting the government in pushing their objectives.
Larger Banks/ NBFCs defaulting continues to be a threat and lot of organisations are in precarious situation. There will be significant second order impacts of this. Public sector banks will keep getting survival capital and will not be in any position to be economic drivers for a long time.
As the Yes Bank case has shown, both RBI and government have avoided the moral hazard of taking it up on their own balance sheet to avert systemic issues. Question is whether troubled entities will get required capital to survive or will asset liability mismatch blow some of these organizations up? Moratorium has actually pushed the issue. Restructuring will further kick the can down the road but real solution – capital is still elusive.
However, the Government has taken some steps in this regard and seems to have found a way around. Measures announced in the last round provides for creation of SPV which will get funds from RBI and funds (upto Rs. 30,000 crs) will be used to buy investment rated debt of NBFCs. It is an indirect way of RBI buying debt of NBFCs but for short term (residual maturity of less than 3 months)
Results of the same will be seen in coming months and depends on the fine print and operational implementation.
4. NPAs and moratorium
The problems are now compounded by lockdown which can significantly increase system level GNPA and can lead to even doubling of NPAs in certain segments like MSME (Current MSME GNPA is 2.3 lakh cr and a CIBIL report says that an equal amount is at risk of slipping into NPA). So banks/ NBFCs are now in collection and survival mode. Some areas of stress adding to the real estate led issues – asset financiers, microfinance, SME loans and segments of retail loans. Least affected would be retail home loans and gold loans at this point. Moratorium has compounded the problem.
– Moratorium of 3 months extended by another 3 months till 31st August. – Interest on moratorium loan to be repaid by March instead of balloon payment at the end of moratorium period
Large portions of books are under moratorium already. NBFCs have a higher share of book under moratorium and are hence, more exposed to the moral hazard risk.
Our thoughts on the moratorium situation – We are in an unprecedented situation with no past precedent of such large scale moratorium. It is difficult to predict customer behavior. We feel behavior (post moratorium) will depend on following factors –
Extent of economic recovery.
Availability of financing from various sources like the MSME credit guarantee scheme.
Nature of loan – security, tenure etc.
Our base case assumption at the moment is that longer the tenure of moratorium higher the collection risks for banks and NBFCs once moratorium is lifted. There is scope for positive surprise on this front if we see a V shaped economic recovery in coming months.
While banks are demanding one time restructuring of loans, we remain skeptical about the implementation of such schemes as past experience with restructuring has shown that it only kicks the can down the road.
On asset quality front, the biggest measure has been taken for regular SME accounts. Government has guaranteed incremental loans upto 3,00,000 cr.
Details of the package: 1) Administered through NCGTC 2) Unsecured no questions asked loans upto 20% of outstanding credit or Rs. 25 cr whichever is lower. 3) 100% sovereign credit guarantee 4) 4 year tenure. 1 year moratorium 5) Interest rate cap: 9.25% for banks and 14% for NBFCs
Due to 100% credit guarantee banks are expected to disburse loans under this scheme which should help restart the MSME engine. However, results of the same will be seen in coming months and depends on the fine print and operational implementation.
5. State governments
– Relaxation of rules wrt withdrawal from sinking fund will allow states to withdraw an additional Rs. 13,300 crs. This accounts for 10% of the states’ FY21 redemptions. Including the normally permissible withdrawal limit, this measure would enable the states to cover about 45% of their redemptions totaling ~INR1.4t in FY21.
Conclusion:
Impact on economy:
RBI’s measures will bring down overall interest rates in the economy. With real rates negative, there is enough push to the banks to restart the lending engine. However, RBI measures are not enough to correct the risk averseness in the system which remains the biggest bottleneck to lending growth.
With RBI cutting rates and banks sitting on excess liquidity, we expect accelerated transmission of rates going forward.
There can be negative implications of lower interest rates on domestic savers and FPI flows in the debt market.
Impact on banks and NBFC stocks:
Markets never like uncertainty. This extended lockdown and moratorium has created uncertainty as to actual level of NPAs. Reported P&Ls are meaningless for the next few quarters and market will start focusing on other factors like collection efficiency, extent of book under moratorium, contingency provisions etc.
We expect financial companies’ stocks to remain under pressure till the time clarity emerges on the actual level of losses that they have to take. Future RBI measures (if any) like one time restructuring can further muddle the waters. Positive surprise can come if there is a V shaped economic recovery and there is only a modest increase in NPAs.
PART I: GLOBAL MICROFINANCE INDUSTRY
by Pranav Mehta, Senior Analyst
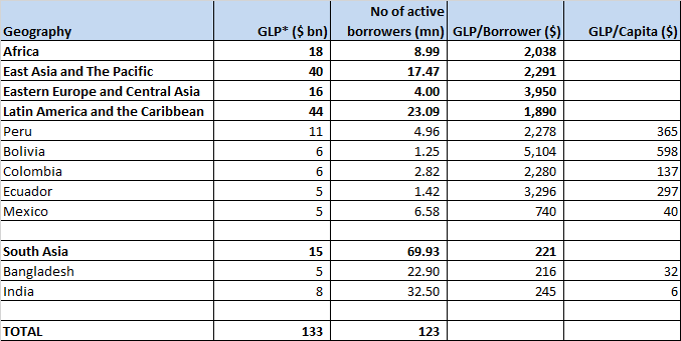
Size of the industry
*GLP: Gross Loan Portfolio
Source: MIXMarket, Media articles
Global microfinance industry growing at ~15%
Latin America is the most developed microfinance market in the world, with most organizations having graduated to individual lending too.
South Asia accounts for ~56% of active borrowers, but only ~11% of GLP, due to low ticket sizes and negligible share of individual loans
A short History of microfinance
Modern day ‘Microfinance’ has its roots in the 1970s , when organizations such as Grameen Bank of Bangladesh with the microfinance pioneer Muhammad Yunus were starting.
Its founded on the premise that access to credit will lift the poor out of poverty
However, it’s a very slow process. Grameen Bank’s own impact research suggests that each year, only 5% of their clients are lifted out of poverty
Over the years, many developing nations have seen boom and bust cycles in microfinance
Overall impact of microfinance on the lives of the poor still remains unclear, with several studies both for and against microfinance
However, many crisis situations across the world has led to increased scrutiny of the microfinance sector
MAJOR MFIs globally
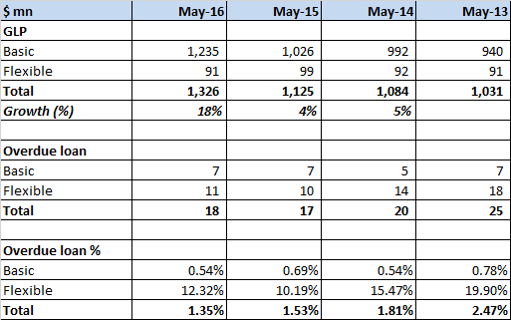
Grameen Bank
Grameen Bank is one of the largest MFIs in Bangladesh.
Source: Company website
Grameen Bank has experienced pretty modest growth rates since last few years
Overdue loans in Flexible category (similar to restructured loan) are at an alarming 12.32%. This is despite loans in Flexible category being treated as overdue (NPA) only if they are OVERDUE FOR 2 YEARS!!!
Assuming that 50% of Flexible Category loans are overdue for minimum 90 days, then overall overdue loans on a 90 DPD basis would be at ~4%
ASA
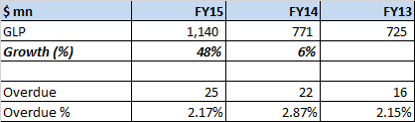
ASA is another large MFI in Bangladesh
Source: Company annual reports
For ASA too, growth picked up in FY15 after few years of modest growth
ASA does not disclose how it calculates overdue loans. Even assuming 90 DPD basis accounting (highly unlikely), the NPA rates are much higher than its Indian peers
MiBanco (Peru)
Peru has remarkable institutional support for financial inclusion, especially good regulatory and supervisory capacity, credit-reporting systems and client protection rules.
The Economist Intelligence Unit has rated Peru as the best country for microfinance every year since 2009
Despite this, Peru witnessed a mini crisis in microfinance in 2014 due to overly leveraged microfinance institutions, leading to overleveraged borrowers
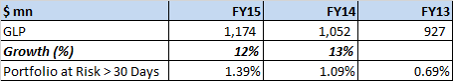
MiBanco is the largest microfinance organization in Peru with GLP of $2.3 billion
It made a profit of ~$17 mn in 2015 (RoA: 0.5%, RoE: 4.4%). It had made losses in the preceeding few years
It has been writing off 4-7% of assets every year since the past 5 years
Bancosol (Bolivia)
Source: MIXMarket
Bancosol has one of the best asset quality amongst MFIs outside India
Bancosol has generated average RoE of 29% from 2009-2015
However, in 2013, new banking law was passed in Bolivia which required that by 2018 all banks extend 60% of their loans, by volume, to the productive sector at no more than 11.5% interest rates.
As a result, Bancosol’s RoE is expected to fall to 15% by 2018. A CLEAR CASE OF A REGULATOR CLAMPING DOWN ON ABNORMAL PROFITS GENERATED BY COMPANIES FROM THE POOR
MAJOR CRISIS Situations globally
BOLIVIAN CRISIS (1999-2000)
Causes of the crisis
50% penetration amongst micro entrepreneurs
Substantial portion of borrowers receiving consumption loans
Multiple loans: 34 percent of the $170 million system portfolio was held by clients with loans in more than one institution
Recession in the general economy triggered the problem
Effects of the crisis
Politicians organized borrowers into associations to protest against the lenders. Organizers promised ‘debt forgiveness’
Later, the associations settled for extended grace periods and interest rates of 2% p.a.
Microfinance institutions lost between 30-50% of their clients in 2 years and had 12.6% overdue accounts by end of 2000
MOROCCAN CRISIS (2009)
Causes of the crisis
Rapid growth for 5-6 years (at near 0% delinquencies)
40% of borrowers had loans from multiple institutions
Due to high credit risk, further investments in MFIs were stopped which triggered the crisis
Limited regulatory oversight
Effects of the crisis
14% overdue accounts in 2009
From the peak of $720 million, loan portfolio fell 25% in next 3 years
MEXICAN CRISIS (2014)
Causes of the crisis
21% of borrowers already had 4 or more loans
Effects of the crisis
Banco Compartamos, one of the most famous “best practice” microfinance banks in the world, has been writing off ~7-8% of its loan portfolio every year since 2014.
40% of all microfinance loans were overdue
SOME OTHER CASES
In Nicaragua, President Daniel Ortega, outraged that interest rates there were hovering around 35 percent in 2008, announced that he would back only those microfinance institutions that would charge 8 to 10 percent interest
Similar crisis situations, due to similar underlying factors, have been seen in other developing countries like Bosnia, Pakistan etc.
AP Crisis
Causes of the crisis
Andhra Pradesh (AP) accounted for 30% of India’s total MFI loan portfolio and 40% of India’s SHG portfolio in 2010, despite only 7% of the total Indian population in that state. 1.5 loans per household in whole state of AP
Various allegations by State Govt: poaching members from SHGs, overleveraging of borrowers, coercive recovery practices that led to multiple suicides
Governor of AP promulgated the AP-MFI Ordinance which severely restricted the activities of MFIs in AP
Effects of the crisis
Significant fall in repayment rates to 10%
Bank funding dried up for MFIs
The large AP-based MFIs – namely BASIX, Spandana, Share, Asmitha Microfin Limited and Trident Microfin Pvt. Ltd. – opted for assistance under the CDR package.
Contagion spreading to other states. SKS’ Non AP Gross NPA shot up to 5.5%
Bangladesh – A Crisis Averted
Bangladesh’s microfinance industry grew large in 1990s and early 2000s. Industry grew at a CAGR of 30% during 2004-2007
In 2007, MFIs began to worry that continued rapid growth could have negative consequences.
Shafiqual Haque Choudhury, the founder and president of ASA, remarked, “Excessive lending into a saturated market could cause a ‘train crash’ that might cause great sector-wide damage and burden borrowers with debts they did not need.”
The country’s big MFIs stopped adding branches and staff around 2008
Growth rates for the industry have plateaued ever since.
However, Bangladesh has never seen a major microfinance crisis due to the prudent steps taken by the MFIs
Thoughts On Valuations
Globally, as most MFIs are in the private domain, its difficult to ascertain accurate valuation of these entities
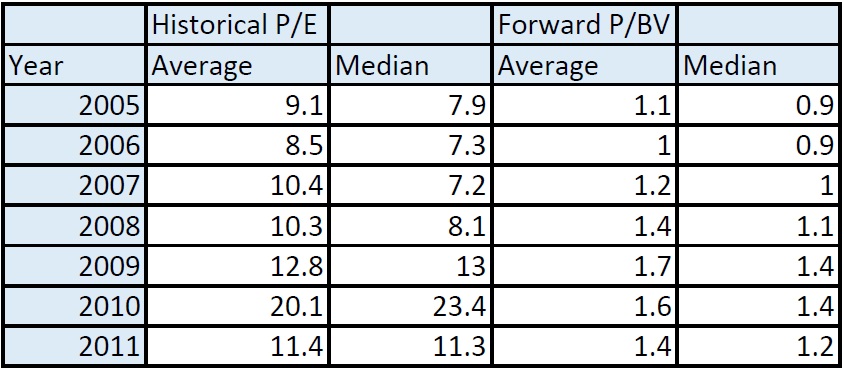
However, in 2012, a joint study by CGAP and JP Morgan of all private equity deals in microfinance between 2005-2011 revealed the following
The PE deals have happened at an average valuation of 1.3x P/BV and 11x P/E
Learnings From The Global Industry
Most of the developed microfinance markets in the world have witnessed periods of rapid growth (boom)
While this can last for several years, it has invariably been followed by a major crisis situation (bust)
PE money and the ‘for profit’ orientation of MFIs leads them on to an insatiable quest for growth. Bangladeshi MFIs, with a more social inclination, have been successful over the years in averting a crisis
MFIs across the world operate at much higher delinquency levels than their Indian peers
Most of the MFIs have GLPs between $1-1.5 bn
Global MFI valuations are much lower than Indian MFI valuations
THE KEY QUESTION THAT ARISES IS:
WHERE IS INDIA IN THE ‘BOOM AND BUST CYCLE’ ?
PART II: INDIAN MICROFINANCE INDUSTRY
Indian microfinance – key nos.
Many microfinance institutions came up in India in the 1990s
The 1990s saw the growth of Self Help Group (SHG) model, whereas the Joint Liability Group (JLG) model gained prominence in the 2000s. All MFIs today operate on the JLG model
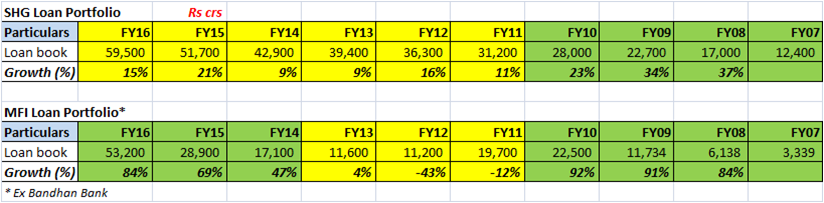
SHG growth has tapered down after FY10, but has been pretty stable
MFIs (JLG) witnessed rapid growth till FY10, post which the AP crisis crippled the industry. In recent years, growth has returned in full swing for the industry
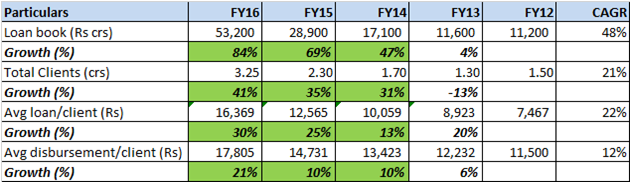
FY10-16 growth CAGR for MFIs is ~15%
Loan growth in recent years has been a combination of volume and value growth
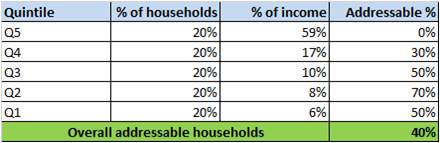
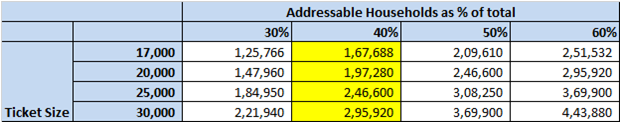
Estimating the addressable market
Estimating addressable households based on distribution of income in India
Based on the above assumptions, ~40% of total households in India are addressable for MFIs
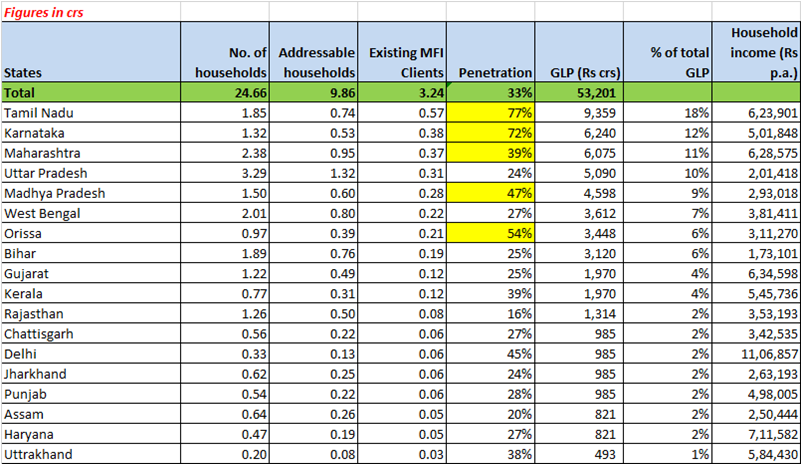
Mapping the current GLP state wise
Estimate of addressable market based on various scenarios
SKS Microfinance has estimated market opportunity at Rs. 2,40,000 crs
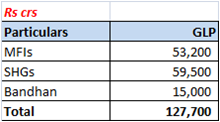
Current size of the industry (including SHGs and Bandhan Bank) is:
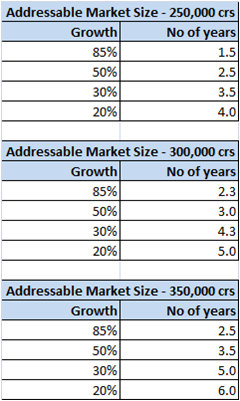
Estimating the addressable market
Assuming that SHGs grow at 15% and Bandhan Bank grows at 25%, following is a calculation of no. of years it will take to exhaust the market potential, based on various estimates of addressable market and growth rates of MFIs:
THE GROWTH CONUNDRUM
Looking at the high penetration rates, it seems obvious that growth rates should come down materially in the next couple of years
However, we have seen from multiple cases across the globe, that such periods of rapid growth can sustain for several years
Indian companies can sustain such rapid growth by increasing ticket size materially from current levels and adding new borrowers, which would increase the chances of overleveraging.
Such a scenario would greatly increase the probability of an AP like blowout happening again
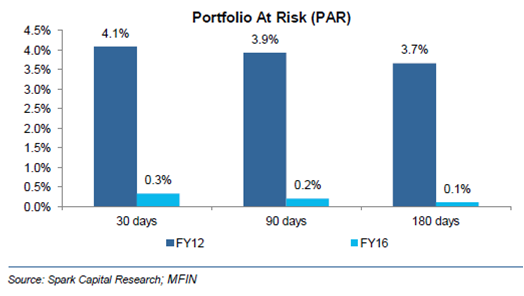
ASSET QUALITY
The asset quality for MFIs has seen a stellar improvement since FY12, leading to NPA levels even better than salaried home loans, considered by many as the safest form of financing !!!
MFIs cite the JLG model (or the Grameen model) as the key to the near zero delinquencies witnessed in the industry
Under this model, loans are collectively disbursed to a group of 5-10 women residing in the same area
MFIs claim that peer pressure, as well as the fact that women are considered much better and disciplined borrowers than men, leads to such stellar asset quality
In case any single member of the group defaults on a loan, the same is repaid by other members of the group (though they are not legally bound to do so)
However, interesting questions arise when we compare JLG NPAs with SHG NPAs
KEY RISK ON REGULATION
MFIs registered as ‘NBFC-MFIs’ are regulated by the RBI
However, the MFI Bill 2012, which is pending to be passed in parliament, seeks to transfer entire regulatory control of the sector to the Government. MFIs are opposing the bill as they prefer to be regulated by the RBI
But most of the top MFIs are now getting converted into Small Finance Banks (SFBs), which eliminates the scope for Government regulation
However, the risk of political interference leading to problems cannot be ruled out, even for SFBs
CONCLUSION
Microfinance sector has enjoyed a dream run in recent growth with 80%+ growth at near zero delinquency, leading to 20%+ RoEs
However, some froth has started to develop in the market. It seems that Indian microfinance market is in middle of a growth bubble
Many countries in the world have seen ‘boom and bust’ cycles in microfinance. While India is witnessing a great boom in microfinance, mindless growth for a couple of years would severely increase the probability of a blowout happening again
For Indian companies to move to the next level, they have to follow the global model and engage in individual lending, where though opportunity is large, it would be an untested model for them, and return ratios would also be slightly lower
Experience of global MFIs and that of local SHGs suggests that its nearly impossible to maintain near zero delinquency levels forever
In summary, the phenomenon of ‘rapid growth’ with ‘0% NPA’ is TOO GOOD TO BE TRUE and will not sustain
VALUATIONS
Why are we asking this question? Why does it matter at all? Shouldn’t one sell if markets are going to fall? There are many definitions of the terms ‘correction’ and ‘bear markets’. It is important to distinguish between the two to better strategize.
If we were to chart the history of the Indian equity markets since 1979, we would note 16 instances of 10-30% declines that lasted over a 3-9 months’ timeframe, these I would categorize as correction. There are however only 6 instances where we witnessed a decline of more than 30% which lasted for more than 9 months and these I would categorize as Bear market. As we speak, markets have already corrected close to 20% from its peak of 9100 and we are into the 6th month of downtrend. It would be prodigious to be able to take a cash call every time the market was about to see a 20% drop. We, however, believe it is almost impossible to get the timing of all of the declines spot-on. The real bear markets are fewer and it is much more productive to call those. Those are the ones we aspire to get right.
The fallacy of the narrative of “Acche Din”
What is a narrative?It is the story that investors tell themselves based on which they take their investment actions. During the campaign of 2014 Lok Sabha elections, BJP coined the phrase “Acche Din”. So phenomenal was the success of this phrase that it instantly struck a note and is yet fresh in all of our minds. Problems arose when people started applying the narrative to their daily lives. Most of the voters are probably more liberal in their interpretation and timeline for the arrival of acche din. But, Equity markets being what they are can only interpret it in binary manner. Markets going up = Acche Din, Markets going down = No Acche Din.
It is not our objective to interpret whether “Acche Din” have arrived for voters or for any other segment of the society. Our objective is strictly restricted to the extent of Indian equity markets. To be able to understand whether this is a bear market or a correction it is important to understand the drivers of the same. Every prolonged market trend has its genesis in some fundamental characteristics. Once the driver of the trends have played out or if the valuations have reached extreme that is a time that one should be worried about serious wealth destruction.
1997 – 2000: Rapid growth in IT with the onset of internet, computing, Y2K drove the DOTCOM bubble which in turn drove the outsourcing boom in India.
2001 – 2003: It was a correction of extreme undervaluation, where 10% dividend yield was the norm.
2003 – 2007: We saw a heady growth phase with growth in asset heavy industries being fuelled by debt, quasi debt and equity dilution.
2008 – 2011: Reversion to mean, as economy had not deteriorated as much as the markets. In addition, response of global central bankers to the crisis was more stimulus and liquidity.
2011 – 2015: Usually bull markets are driven by falling interest rates and pickup in economic growth. But this bull market has not been driven by either. In our opinion, it’s a trend driven by improvement in ROE. It has been a phase dominated by survivors and market leaders. Businesses with a differentiated product, or expanding into newer markets have done well. Drivers of ROE’s have been cost-cutting, expanding market share, falling input costs, judicious use of capital. In other words, going has been tough and only the tough got going. The usual rising tide lifts all boats have been missing. Because it is still a receding tide. Businesses and promoters that have been swimming naked are in full view of the market.
Post May 2014, the popular narrative believed by the market participants was that we are entering an era of economic revival due to the arrival of the new government at the helm with an unprecedented majority. The market participants that did place their bets based on such a narrative, find themselves the most disappointed with the revival of the economy taking longer than expected. Worsening of NPA cycle, China slowdown, real estate slowdown, rural economy slowdown further accentuated by retrenchment in parallel economy has actually completely washed away the economic revival narrative. Contribution of stocks representing this narrative to the market returns has been negative post-election results and it got further accentuated in the current downtrend. This is not to say that this narrative is not going to pan out. Probably, this is a good time to be a contrarian and give it some serious thoughts. The key however, lies in understanding the pace of economic revival, pace of reforms, areas of revival and pace of fall in capital cost.
If this is the beginning of a pro-longed downtrend, what could possibly be the drivers of this trend? (Note: This is not an exhaustive list, just the common narratives found in market commentary)
Chinese slowdown
Chinese slowdown has been the reality before its equity markets started cracking. Electricity consumption in 1H15 grew by only 1.3% vs. an approximate growth rate of 5.5% seen in the first half of 2014, 2013 and 2012- this in itself is a simple illustration of the Chinese slowdown. Fall in Input costs also have been indicating Chinese slowdown. Given that India competes with China for raw materials as well as fund flows, the slowdown is a net positive for India. There are however a few pockets that will be hurt such as the raw material exporters that see China as a trade partner.
It is however important to note here that China is currently characterized by an industrial slowdown. The consumption portion of the economy, albeit a small part, will continue to grow; especially with renewed government focus to drive consumption. Indian exporters of finished goods and branded products could therefore see China emerge as a potential market.
Global deflation scare
Falling raw material prices have led to disinflation globally which has sparked off a deflation scare. This we believe will compel central banks to continue to pursue their dovish strategies to revive their respective economies. All of this liquidity will find its way to stronger and improving macros. India will stand out as a destination for the same once the dust settles.
US rate hike
Chances of a 25bps rate hike by the U.S.Fed in September nose-dived with jittery global markets and weak jobs data of the past week. However, what really matters is the policy stance adopted by the Fed subsequent to the 25bps rate hike, which we believe will continue to be dovish. Central bankers spent Central bankers from US, Europe, Japan and China have been following loose monetary policies to lift economic growth. Fear is that if global growth does take a nose dive again then central bankers have no tool left to revive the economy. India on the other hand has been preserving its firepower. India has erred on the side of caution with expanding its balance sheet. India’s government finances are on the mend. Here also, India stands out from the world.
Implications for India?
As discussed above, Chinese slowdown or a deflationary scare is a net positive for India. Indian economy can remain an island of positive out performance. We live in a world of connected flows governed by international factors and hence Indian markets will surely get impacted in the short run. It would therefore be foolhardy to believe that we would not witness any collateral damage in the Indian markets. How much and how long is the question. It is important to remember that India is the collateral damage and not the eye of the storm. Once the storm passes and the dust settles, India should emerge a stronger economy. A strong and decisive government along with a prudent central bank that ensures a strong balance sheet for the country will make us ready for growth once these headwinds in the global markets pass. In the meantime, extreme valuations in quality and growth are cooling off, offering even more compelling entry points to own a good business.
Overestimation of domestic recovery and accentuation of problems in domestic financials due to the delay of recovery are problems caused more by the excesses of 2005-2007 rather than new problems created post 2009. The markets have recognized these excesses completely, as is palpable from the gross under- performance of the real estate, metals, utilities sectors compared to the broad indices and other sectors.
Is this is a serious market top (a.k.a 2000 or 2007)?
India is the collateral damage in the current global storm however we hardly believe that the high seen prior to the current fall is a serious market top that cannot be taken out for a few years. The following are some of the indicators which would usually suggest a serious top in the market. Some of these conditions may or may not exist in the global markets but we don’t believe that any of these indicators characterise the recent highs in the Indian equity markets.
Rapid growth in fund raising
The trend in equity issuances suggests that the market are currently nowhere near the euphoric state of 2007 (Ref to Fig 1 and Fig 2). Driven by Reliance Power, fund raising by domestic IPOs surged in FY2008. The number of issues too started rising with the progression of the bull market, peaking in 2007. We are currently nowhere near to seeing those characteristics in the equity markets.
Extravagant capital allocation decisions, diversification and outsized acquisitions
As a precursor to the financial crisis of 2008, we saw a flurry of large scale M&A deals being closed. Tata Motors bought JLR for $2.3 billion, Hindalco purchased Novellis for $5.9 billion, and Tata Steel bought Corus for $12.2 billion amongst many more. The total quantum of the M&A deals signed by Indian companies rose to $33.1bn in 2007 from $15bn in 2006 and $4.3bn in 2005. These transactions tested the strength of the companies with most deals outsizing the balance sheet. Still reeling from the excesses of 2007, we do not see such M&A yet.
Extreme retail participation
The classic example of this would be the Reliance Power IPO in Jan 2008, Biggest ever IPO of the time. FIIs oversubscribing by 82 times, HNIs by 163 times and retail investors by 15 times. Brokerages complained of running out of new demat account forms with the surge in account openings in order to subscribe to the IPO. We do not see any such exaggerated IPO issues and retail participation right now.
Over leverage
The government’s balance sheet continues to strengthen with the government debt to GDP ratio declining.
Over valuations
Before the 2008 market crash, the market capitalisation to GDP ratio rose to 103. The recent highs had taken this ratio to 79. The pockets of stretched valuations that we saw within this market within “quality” and mid-cap stocks seem to have corrected for the most part bringing the Market Cap to GDP ratio down to 69.
Over optimism
Usually, serious market tops are associated with scores of anecdotal evidence of euphoria across general public. Neither newspaper headlines nor retail participation suggest an over optimistic outlook of the public. Prior to the 2008 crash, we see a surge in the google trends index for the word ‘SENSEX’ in India. A google trends index shows “how often a particular search-term is entered relative to the total searchvolume”. The index below shows a rise in 2007 making a peak in Jan 2008 prior to the increased searches we see during the crisis itself. This itself depicts the over involvement of the public in the markets pre the financial crisis of 2008-09. This is visibly not the case right now.
Why a pullback was par for the course?
Overestimation of recovery
Many investors and onlookers bet on India’s immediate economic revival with the election of the new government with an overwhelming majority. There was an onslaught of high GDP growth and company earnings estimates. The recent pullback has tempered expectations. Moody’s revised FY16 GDP growth estimate to 7% from 7.5% and Fitch to 7.8% from 8%.The consensus SENSEX EPS estimates for FY16 have been revised down from Rs. 1750 (in April 2015 to approximately Rs. 1530 post this earnings season. We see a similar revision from Rs. 2100 to Rs. 1900 for FY17 earnings estimates.
Complacency in highly valued stocks
In the last year we saw investors being complacent and flocking to the popular “high quality” stocks leading to stretched valuations for these stocks.
Deteriorating global environment
The recent actions of the Chinese government in order to engineer a soft landing have made its slowdown apparent to the global markets. The moves in commodity prices itself are evidence enough to illustrate this industrial slowdown. Economies such as Brazil and Australia, that rode this growth trajectory with China by exporting raw materials to the Chinese, face a slowdown themselves. Extent and pace of slowdown seems to have worsened.
Lots of moving parts in currency and bond markets
Following the decline in commodities markets, we noted an increased volatility in currency and debt markets. While the EM currencies tumbled, Euro and the Japanese Yen made gains against the dollar. The events of this week have reduced the probability of a rate hike by the Fed in September which could result in sustained volatility in the currency markets. The bond markets too have been very volatile, with trends reversing in the major 10yr yields, April onwards. The volatility in these markets resulted in increased pressure on many of the foreign portfolios, consequentially resulting in India being the collateral damage in this storm of changing flows.
6 year uptrend in developed markets with no major correction
The dominant developed markets such as the U.S. and Germany have seen a consistent uptrend from the 2009 lows with the exception of a correction during the 2011 euro crisis. These markets were therefore due for a pullback with India being collateral damage due to connected global flows.
Why India’s bull market will continue?
With valuations no longer being super demanding we believe that India has the structural elements in place for the equity markets to remain bullish.
Recovery delayed, not denied
Investors that remain most disappointed in the market today are the ones that have placed their bets on the new government jump-starting the recovery. Economic revival though delayed, is bound to germinate given the favorable trends in the economy. Whether it is 2HFY16 or 1HFY17 is the only question in our mind.
Crude windfall: A shift from $100/bbl oil price reality to the $50/bbl oil price environment will result in annual savings to the tune of $70bn (approx. 4% of GDP) for the Indian economy. A fall in commodity prices has also led to inflationary expectations in the country to recede.
Front loaded capex: Government spend on capital in railways, roads, defence, etc. sectors is gathering steam. A first in its history, the Indian Railways released their quarterly numbers for the June ending quarter. In Q116 itself, the transporter reported a staggering 134% jump in its capital expenditure to Rs. 17,734 crores. Of the Rs. 82,000 crores approved for the dedicated freight corridor, Railways has already floated tenders for over Rs. 19,000 Crores. Until July, the National Highway Authority of India (NHAI) had put up projects worth Rs. 48,000 Crores for bidding.
Improved government finances: The windfall from lower crude prices along with systemic changes in spending programs such as subsidies, has aided the government to contain fiscal deficit at 4%, beating its own target of 4.1% and the previous year’s deficit which stood at 4.5%. The government expenditure on subsidies has come down to 2% of GDP from 2.2% in FY14 further aiding this fiscal consolidation. Structural factors remain intact India has a growing, young population. An estimate by United Nations suggests that India would provide an additional 124 million people to the global labour pool by the end of 2025. This is far greater than the 12 million to be contributed by China, 5 million by USA or the 28 million by Europe. This demographic dividend along with a stable government in the centre with resources to spend, will sustain India on a growth trajectory.
Alternative assets peaked out
The financial crisis of 2008-09 caused Indian households to increase their savings in physical assets such as gold and real estate. This trend peaked in FY13 with roughly 70% of the household savings being parked in physical assets. As inflation rates continue to decline, the real rate of return on financial savings will rise, convincing households to deploy a larger chunk of their household savings in financial assets.
Domestic flows
Flight of foreign capital is being matched 0.8: 1 by DII’s. Furthermore, more of the household savings will be directed towards financial instruments and eventually equity will see a rising allocation domestically. We believe this is a beginning of a trend as seen in the chart below.
Factors impacting ROE still show a favorable trend
Interest rates: The RBI has already instituted rate cuts of 75bps since peak. With inflationary pressures cooling off and the rupee staying relatively strong amongst other EM currencies, we will see more rate cuts being implemented eventually.
Gross margins: This earnings season has demonstrated the gains in gross margins for many. With commodity prices continuing on their downtrend due to a Chinese slowdown, we could see a further improvement in gross margins.
Deleveraging: Some of the companies which suffered from the excesses of 2007 are now able to deleverage and clear their books.
Conclusion
Downtrend we are witnessing in the markets is corrective in nature is what we conclude from our analysis. Price correction can range from 20 – 30% and it can last for a period of 6 to 9 months. One should use these externally induced volatility in markets to increase allocation to Indian equities. Since economic environment is till deteriorating, stock picking will remain the key.
Please read the following carefully and select your residency jurisdiction
*If you access this website by giving false declaration, you shall be solely liable/responsible for any adverse consequences suffered, legally as well as financially, pursuant to use of any information contained in this website.