The AMC industry in India has seen exponential growth in the last couple of decades. From less than Rs. 1 lakh cr at the turn of the century, the Indian AMC industry today boasts of an AUM of more than Rs. 30 lakh cr. However, by all accounts, we have just scratched the surface in terms of the potential growth of this industry. Buzz words like “under penetration” and “financialization of savings” get thrown around a lot during any discussion on AMCs in India. Via this deep dive into the AMC industry, we try to understand these and many other drivers of the industry. Fundamentally, we try to answer a couple of key questions –
1. Indian AMC industry will grow, but can it grow profitably?
We are confident that this industry can grow at 15%+ for a long time due to a variety of growth drivers discussed in detail in this study. However, certain concerns have emerged in recent years on profitability, especially considering the global experience. Globally, this industry is now at a much more mature stage of growth and grappling with profitability pressures like the rise of passive flows. Our study finds that while the global AMC industry will continue to struggle for profitability, the Indian AMC industry should be able to protect its profitability for few more years at the very least.
2. If yes, what is the best way to play this theme?
Having answered fundamental questions about growth and profitability, we dig deeper into the AMC business model to understand which kind of model to bet on – bank backed AMC or foreign AMC? Large AMC or small AMC? How important is performance, brand, and various other factors in the success/failure of an AMC? Our study finds that scale is very important in the AMC business. Large AMCs backed by bank-led distribution are best placed to grow at a good pace while maintaining best in class profitability.
We believe that this sector has a long runway of profitable growth. Our findings reinforce our bullish view on this space.
DEEP DIVE INTO THE AMC INDUSTRY
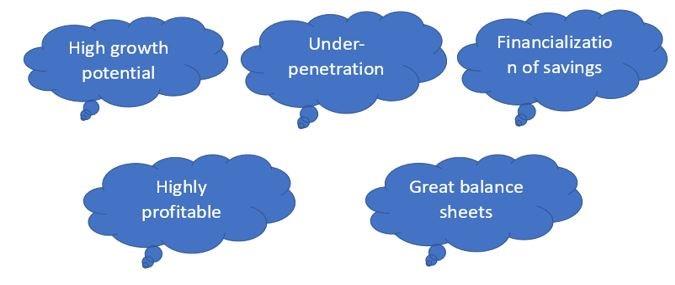
What comes to our mind when we think of AMCs in India? Probably a lot of these cool sounding things –
Seems like a very exciting opportunity! But before getting into India, lets first have a look at the key global data and trends.
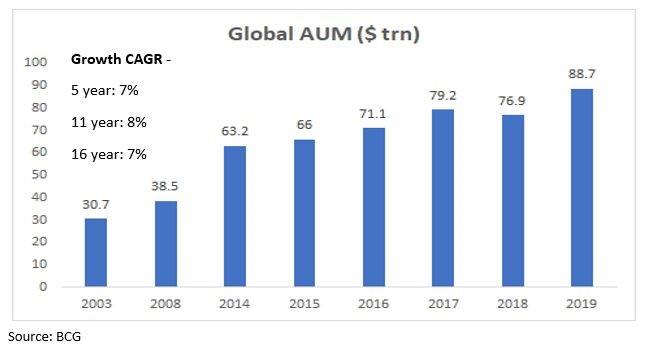
Global Asset Management AUM
The global asset management industry’s Asset Under Management (AUM) has been growing at ~7-8% CAGR. As of 2019, global AUM was more than $88tn vs $63tn as of 2014.
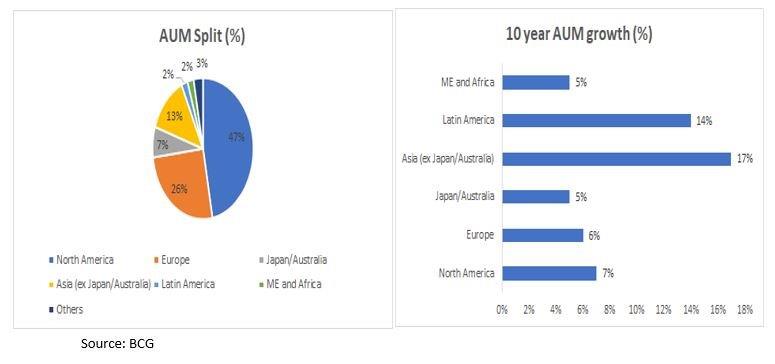
AUM split and growth by key regions
A major chunk of this global AUM is concentrated in North America and Europe. But Asia and Latin America are the fastest growing geographies with Asia growing at 17% CAGR over last 10 years.
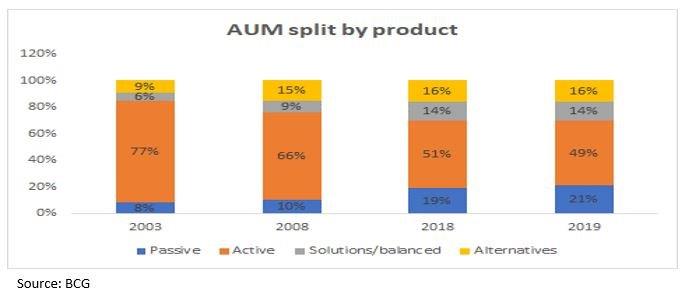
AUM split by product
Over the last 15+ years, the share of passive AUM has gone up from 8% to 21%, whereas the share of active AUM has gone down from 77% to 49%.
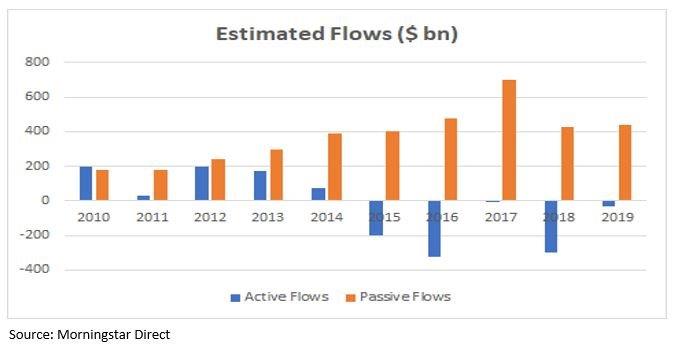
Flows split by style (only for USA)
From 2010-19, passive funds had inflows of $3.8 trn, while actively managed funds had outflows of $185 bn.
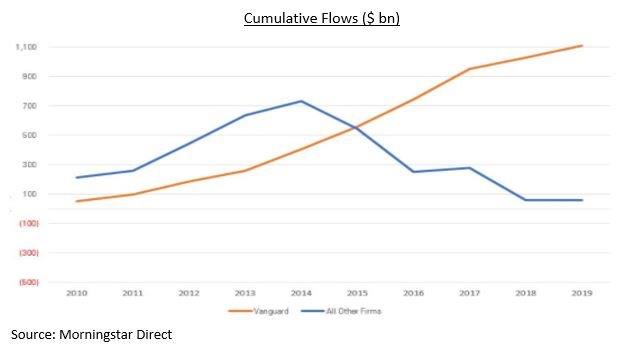
The Vanguard decade
As passive flows in the industry picked up, Vanguard was a big beneficiary. It collected about $1.1 trillion during the decade, while the rest of the industry combined took in less than $100 billion net!!!
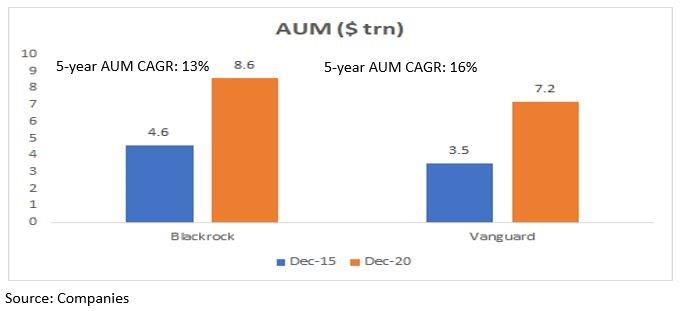
Industry becoming more and more concentrated
Blackrock + Vanguard (top 2 global AMCs) share in global AUM has increased from 12% in 2015 to 16% in 2020.
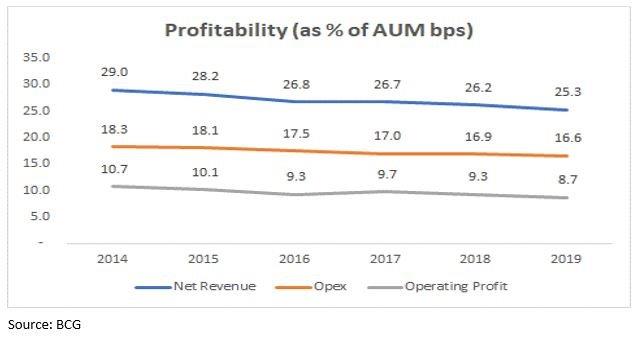
All these factors have put pressure on profitability…
Note: Based on data of top 100 global asset managers which represents more than 60% of global AUM.
AMCs typically earn significantly lesser fees from passive funds as compared to active funds. So, with huge flows seen in passive funds, profitability of AMCs has been under immense pressure in the last decade.
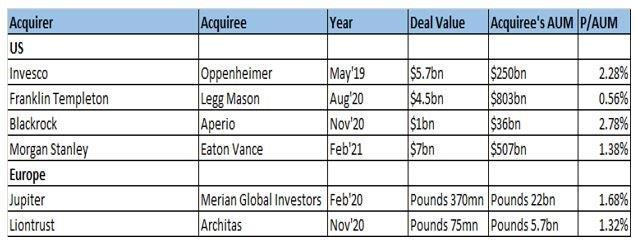
This has led to consolidation in the industry. In recent years, many M&A deals were observed in the industry with many big players like Oppenheimer and Eaton Vance being bought out.
Summary of key global trends
– Overall AUM growth rates have been at ~7-8% for the last 15-20 years. – Asia (ex-Japan and Australia) and Latin America are the fastest growing regions with 14-17% long term growth. – Shift from active to passive investing is the megatrend in the industry. The numbers for passive flows in the last decade are simply stunning! – This has led to significant pressure on profitability of AMCs due to downward pressure on fees, leading to consolidation in the industry. – Top AMCs like Blackrock and Vanguard have capitalized on the passive trend to grow much faster.
OVERALL, IT SEEMS THAT GLOBAL AMCs’ P&L IS UNDER SIGNIFICANT STRAIN. PROFIT GROWTH IS EXPECTED TO BE MUCH LOWER THAN AUM GROWTH.
Considering these global trends, should we still be as excited about the India opportunity?
Indian AMC Industry
Historical Growth
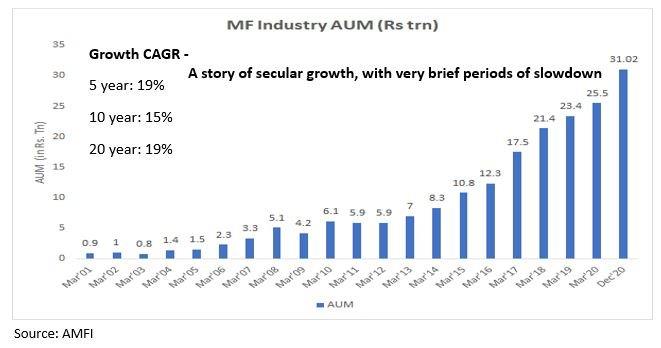
Indian MF AUM has grown at a healthy pace in the last 20 years with very brief periods of slowdown. Over the last 5 years it has grown at 19% CAGR to reach Rs.31tn which was a mere Rs.6tn in 2011.
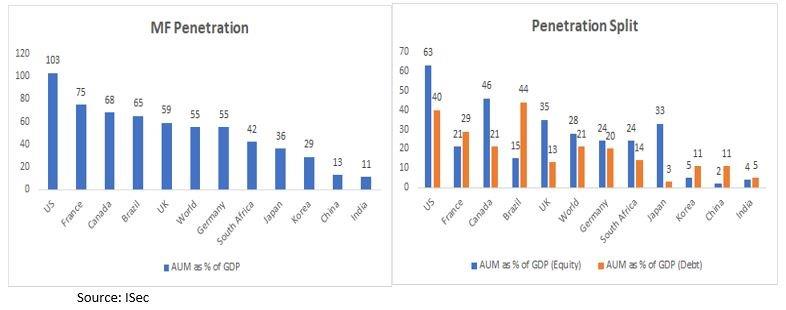
But despite this growth, the industry is still underpenetrated.
India’s AUM to GDP ratio is one of the lowest in the world.
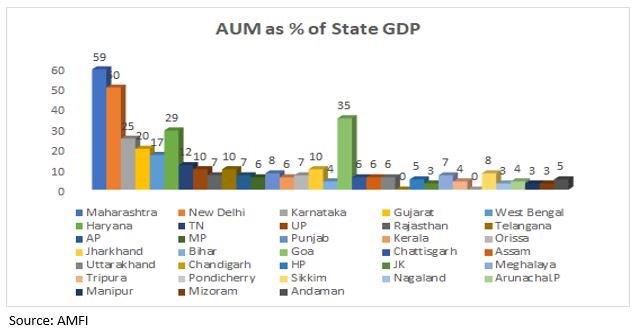
Under-penetration (state wise)
An analysis of state-wise penetration data reveals that only a handful of states in the country are well penetrated. Most of the smaller states fall way below the national average.
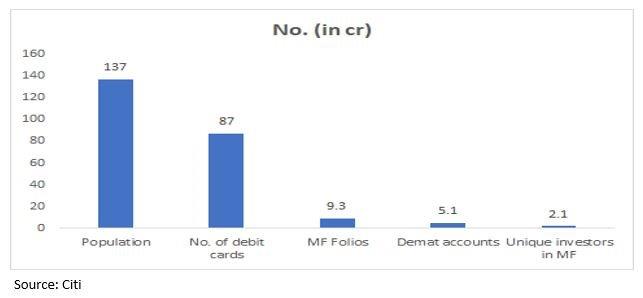
Various accounts
India has just 2.1 cr unique MF investors (9.3 cr total MF folios). We have barely scratched the surface! In India, under-penetration is combined with high savings rate – a good combination to have!
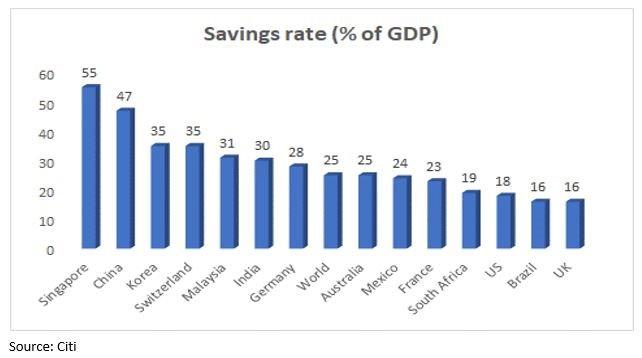
Savings rate
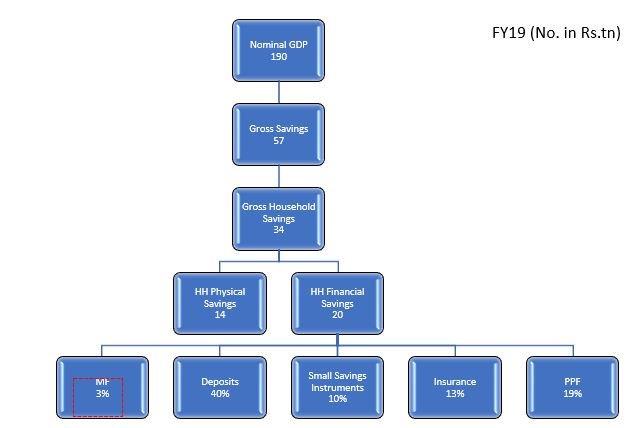
But how does India save? For illustration, let us look at FY19 nos.
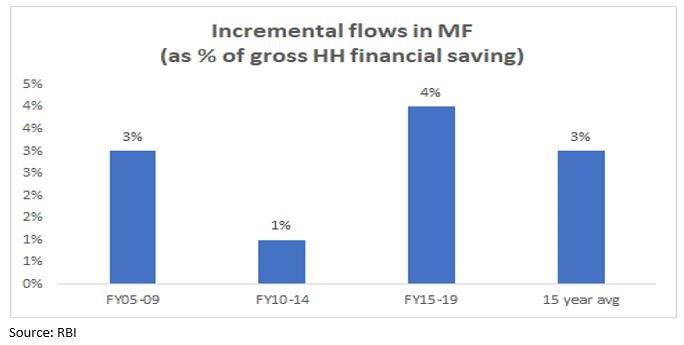
In FY19, ~58% of gross household savings flew into financial savings. However, only 3% of household financial savings found its way into MFs.
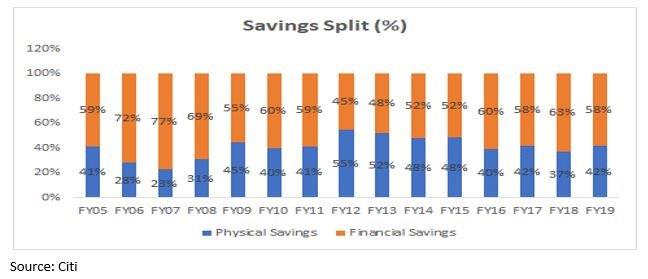
Financialization of savings – Cyclical or structural?
The share of physical and financial savings in the total savings pie keeps fluctuating, reflecting a cyclical nature. To illustrate, share of financial savings in total savings was as high as 77% in FY07, as low as 45% in FY12 and settled at 58-80% in last few years.
There is a bigger opportunity out there for MFs – taking share away from other financial assets.
Big opportunity – taking share away from other financial assets.
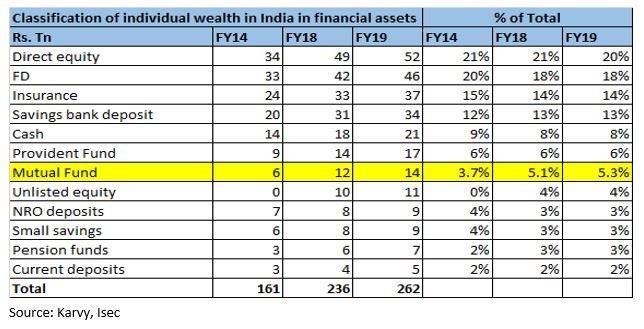
In the last 15 years, only 3% of incremental gross household financial savings has flown into MFs and only 5% of individual financial wealth in India is in MFs.
Under-penetration + high savings rate + scope for market share gains = long growth runway for AMCs. The above factors plus a historical 1.4x multiplier on nominal GDP growth gives confidence of 15%+ long term AUM growth. However, near term cyclicality will always be a factor.
But what about the profitability question? What about the global megatrend of rising passive/ETF flows and lower fees?
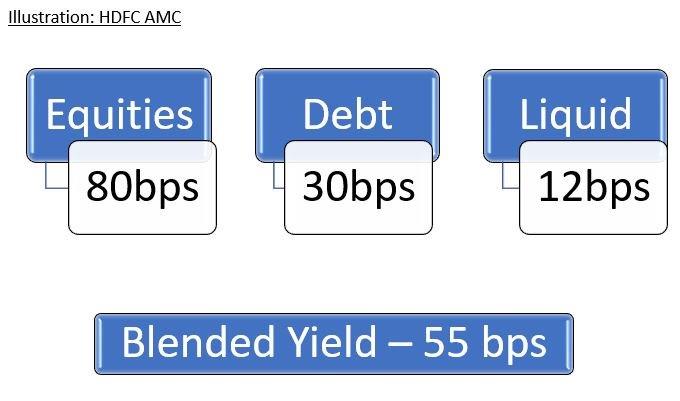
To answer these questions, first let’s understand how does an AMC earn fees?
Active equity funds generate the highest fees while liquid funds generate the lowest of the three. Passive funds have significantly lower fees across all categories.
Impact on profitability can come from –
– Rising share of passive/ETFs – Mix change from equity towards debt or liquid – Any cut in Total Expense Ratio (TER) for equity funds
Let us take a look at these factors one by one…
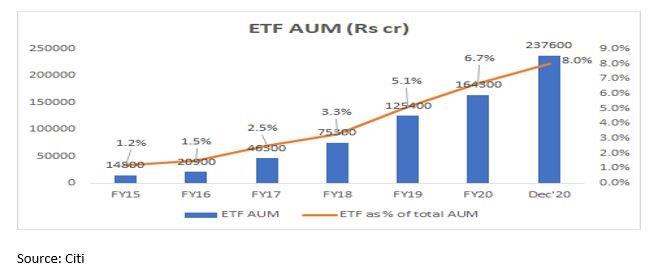
– Growth of ETFs in India
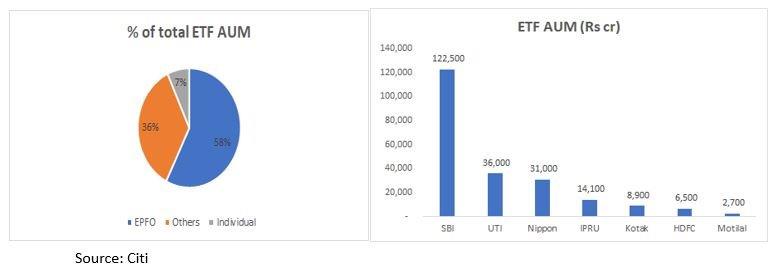
ETF AUM has grown exponentially to Rs. 2.3 trn (~8% of total AMC AUM)
Scary? Cause for concern? Not really.
In India, ETF AUM is restricted largely to EPFO and other wholesale (primarily Government) channels. EPFO can invest 85% of its annual deposits in debt instruments and the remaining 15% in equity invested via ETFs. SBI MF and UTI MF run the EPFO mandate and share AUM in the ratio of 3:1.
Pure retail flows into ETF are miniscule and not gaining too much popularity as of now.
ETF AUM as % of AUM is significant for SBI MF (27%), UTI MF (22%) and Nippon (15%)
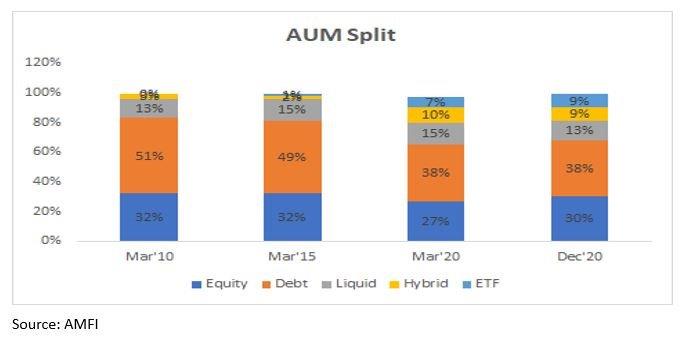
– Equity mix has been steady.
Share of equity has remained broadly stable over long term, short term fluctuations cannot be ruled out.
– History of TER tweaks by SEBI
– 2009 – Removal of entry loads on all MF schemes by SEBI – 2012 – SEBI allowed AMCs to charge incremental expenses of 30 bps on new fund flows from B15 (beyond top-15) cities. – 2018 – Reduced a 20bps permissible charge in case of mutual fund schemes where exit load is not levied to 5bps. Issued revised terms and definitions and permitted additional TER of up to 30 bps for inflows from B30 cities instead of B15. All commissions to be paid from the scheme P&L and distributor commissions to be only on a trail basis (no upfront commission). – 2019 – SEBI cut the TER chargeable to investors.
Not all tweaking by SEBI has been negative. Generally, they prefer to bring pricing down only after size of the industry has grown multifold. With the last round of TER cut happening in 2019, it is expected that the regulator will not engage in major pricing action for the next few years.
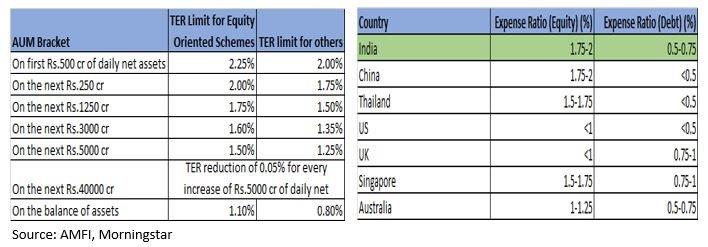
Is India’s TER higher than global standards?
India’s TER is in line with most developing countries. Some developed countries like US and UK have significantly lower TER. But if we look at India-focused funds in US, we see that the TER for these funds is in line with funds in India.
High pricing power>>TER cuts have been passed on
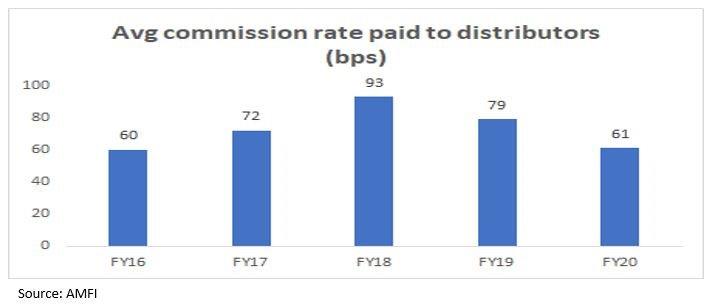
In any case, whenever SEBI has cut TER for the industry, most of the AMCs have been able to pass it on in the form of lower distributor commissions.
Risk: Threat of new competition/disruption
– In recent months, we have seen a plethora of companies applying for AMC license – Helios Capital, Alchemy Capital, Wizemarkets Analytics, Bajaj Finserv, Zerodha, Samco Securities, NJ India Invest etc. Some of the new applications follow SEBI’s move to ease the profitability criteria for setting up an AMC. In December 2020, SEBI said sponsors which don’t fulfill the profitability track record can still set up a fund house, provided they have a minimum net-worth of Rs 100 crore, instead of Rs 50 crore that is otherwise required. Some other companies like Groww and Flipkart founder Sachin Bansal’s Navi Technologies have taken the inorganic route to obtain a license.
– With the entry of these players, the competitive scenario is set to intensify. The new entrants will try to disrupt the distribution as well as fund management model prevalent in the industry. Given that active management is already a crowded market and the nascent stage of passive management in India, some players like Zerodha plan to exclusively focus on passive funds. Some degree of compression in yields due to new competition cannot be ruled out. However, in event of yield pressure, the distributor category will be more vulnerable given the AMCs’ dominant position in the industry chain. Also, incumbents have advantage of scale. As seen later in this study, it is very difficult to turn an AMC profitable at a smaller scale of AUM. That challenge awaits all the new entrants. Moreover, new entrants will expand the existing market which can in turn prove to be beneficial to the incumbents. For example, 65% of investors on Groww’s MF platform are first time investors.
Growth + Profitability is good. So kya leneka? By that, we don’t mean to give a stock tip. The focus of this study is to understand within AMCs, which is the right model to bet on – bank backed AMC or foreign AMC? Large AMC or small AMC? For that, it is important to first understand the industry landscape.
Industry landscape
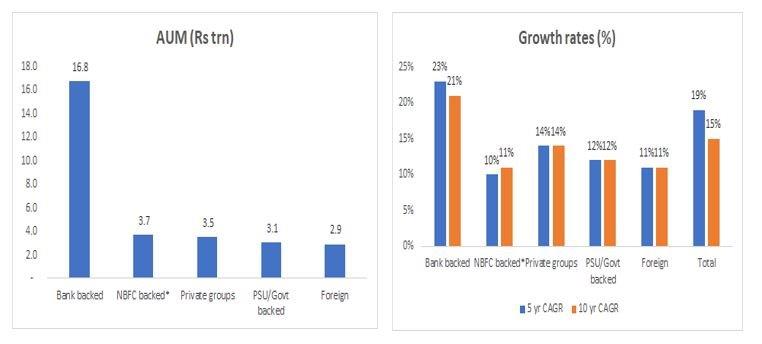
There are currently 42 AMCs operating in India. By ownership, they can be broadly split into –
*For this calculation, Nippon MF has been considered as NBFC backed AMC
Bank backed AMCs have grown the fastest; led by distribution benefits and strong brands. All other groups have grown at similar rates and are much smaller than bank backed AMCs. All other categories are in Rs. 3-3.5 trn range – in other words even smaller than one HDFC AMC!
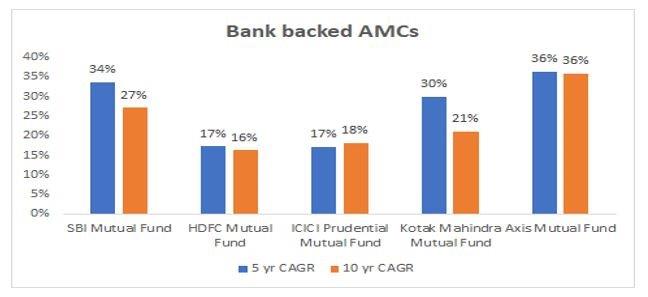
Growth in bank backed AMCs has been broad based. Axis has been the one with highest growth rate albeit with a lower base than its peers.
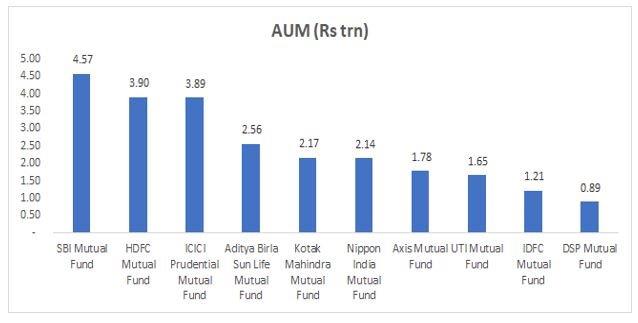
Top 10 AMCs dominate the market
Share of Top 10 AMCs has improved to 83% in 2020 vs 78% in 2015. Big players have grown bigger over the years.
What are the key drivers of growth?
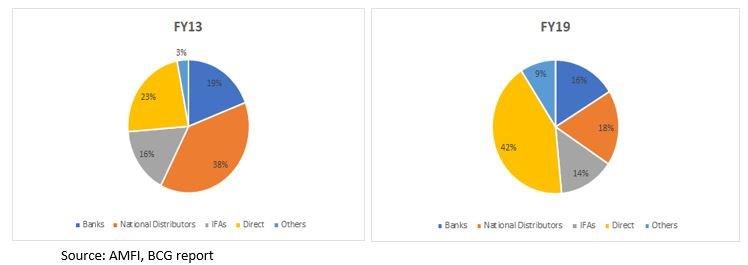
– Distribution
In recent years, Direct as a channel has grown by leaps and bounds whereas the share of other channels has come down. One thing to note here is that AMC profitability is not materially different in Direct vs Regular model. The distributor fee in the Regular model is passed on to customers in the Direct model in the form of lower TER. As Direct gains more share, it is the distributor that stands to lose the most.
– Brand – Performance
How important is performance?
In the last few years, Axis MF and Mirae MF have been the standout AMCs in terms of scheme performance. While Axis MF has grown at a healthy pace, Mirae MF has been the fastest growing AMC (organically) in the last 5 years.
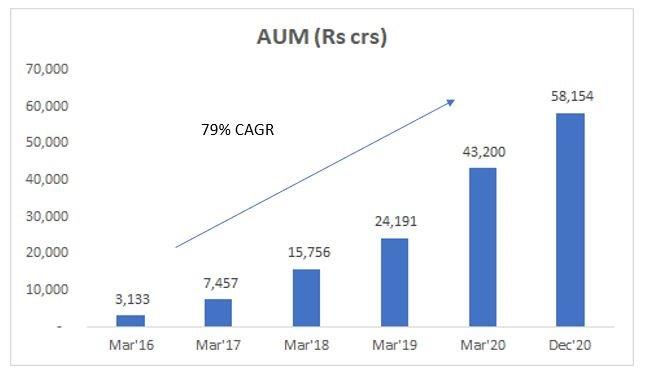
Case Study – Mirae Asset Mutual Fund
Mirae’s schemes have been in the top quartile in terms of performance across most categories in the past few years. Such level of stellar performance has enabled them to grow their AUM at a rapid 79% CAGR since 2016. Mirae is a rare example of a foreign AMC succeeding in scaling up their operations to a decent level in recent years.
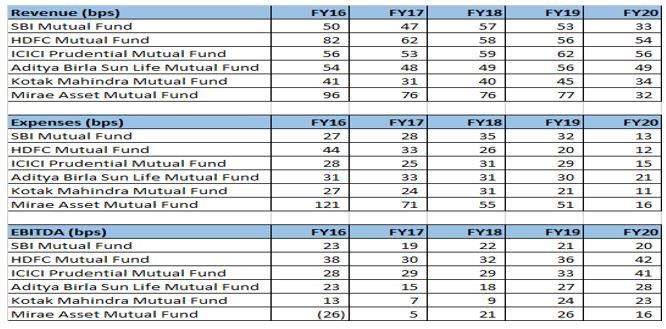
Mirae vs Top 5 MFs
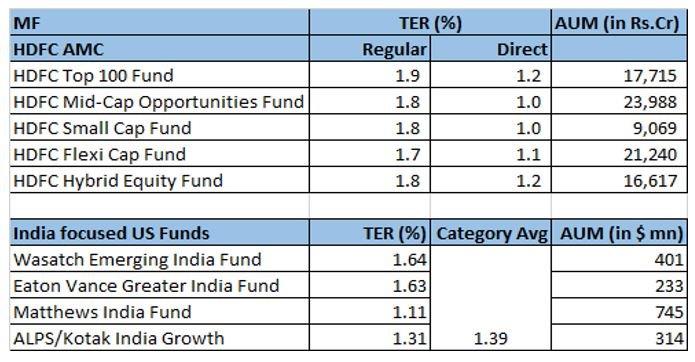
While Mirae has seen a major improvement in profitability, it is still much lower than the Top 5 AMCs’ profitability (especially HDFC and ICICI MF). The difference is on 2 counts – net revenue realization is much lower for Mirae presumably due to higher distributor payouts than large AMCs and due to scale benefits, larger AMCs have much better cost absorption. If this is the differential in profitability with large AMCs for the best performing “small” AMC, then what about other small AMCs?
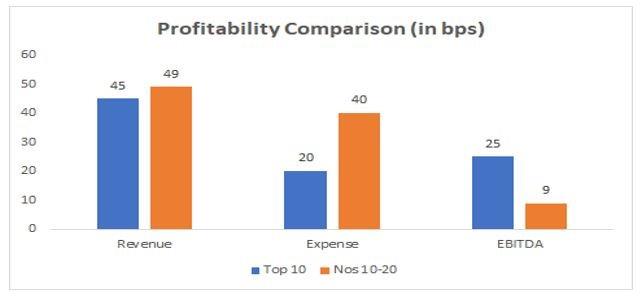
Avg profitability – Top 10 vs No10-20
Smaller AMCs command a slightly higher fee on average (maybe due to better equity mix) but have significantly weaker cost absorption as they lack the advantage of scale.
Conclusion: Size matters…. a lot!
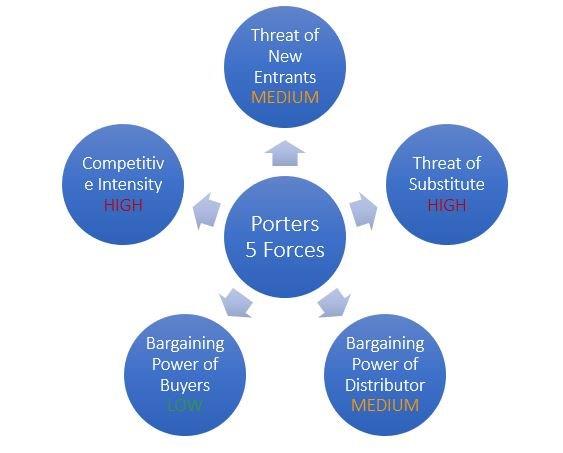
Porter’s Five Forces
Following are the key takeaways from a survey we conducted amongst distributors for this study –
Does it still make sense to sell MFs?
Yes. Still many opportunities to make good commission.
Which MFs are most popular/easily sold?
Despite underperformance, HDFC still remains most sought after. Additionally, there are always flavours of the season – Axis, Mirae.
Do clients care which MF you are investing in?
Most of them do care. Lot more push required for selling smaller/new funds.
What points do you consider while deciding which MF to invest in?
Commission, consistency, fund manager, brand
Which AMCs give highest commission to distributors?
Smaller AMCs like Mirae, Invesco continue giving good commissions as in the past. Least sharing done by HDFC, ICICI but those AMCs have biggest customer pull.
Does rising trend of direct investing pose a big problem for distributors?
Not really. Many a times customers who opted for Direct have moved back to advisors after having bad experiences.
Which MF does a client prefer – best brand or best performance?
Advisors generally create a portfolio with mix of both.
Any demand of ETFs from retail investors?
Sporadic enquiries. Nothing major.
Valuations
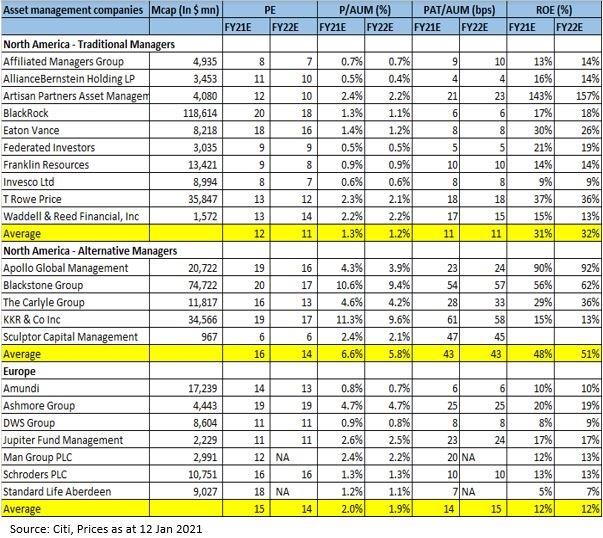
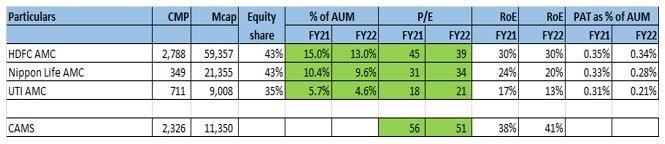
Global Valuations
India Valuations
Global players command a significantly lower valuation as compared to Indian AMCs.
Why India deserves a premium valuation to the world?
– Higher growth (19% CAGR vs 7% CAGR for the world) – Under-penetration – Higher current profitability – Fewer headwinds on future profitability
Conclusion
– Global AUM growth is 7%. But profit pool growing much slower. – Indian AMC industry is set for strong growth of 15%+ for the next decade. However, growth will not be linear and prone to cycles. – Indian AMCs are in a much better position to protect their profitability than global peers. – Within Indian AMCs, the model to go for is large AMCs with strong brand and distribution backing like bank backed AMCs. – Valuations look optically high for Indian AMCs. However, the premium to global peers seems justified due to superior growth and profitability.
In March 2021, Tamil Nadu Investors’ Association hosted our MD & CIO Mr. Ravi Dharamshi, who spoke about about Prince Pipes, an opportunity.
Quick Summary: – Why look at Prince pipes? Real estate is on the cusp of revival – Home Improvement is probably a better way to play Real Estate Theme – Plastic pipes is witnessing the fastest growth within Home Improvement – Accelerated Consolidation within sector helping better positioned players – Govt’s Atmanirbhar push to help domestic manufacturers – This is the most mis-priced bet in this industry
Watch the video in the link below for a more detailed presentation and view:
Disclaimer
Valuequest Investment Advisors is regulated by the Securities and Exchange Board of India as a provider of Portfolio Management Services and as an Investment Advisor.
The information provided in this video does not, and is not intended to, constitute investment advice; instead, all information, content, and materials available on this newsletter are for general informational purposes only. Information on this website may not constitute the most up-to-date information. The enclosed material is neither investment research, nor investment advice. The contents and information in this document may include inaccuracies or typographical errors and all liability with respect to actions taken or not taken based on the contents of this Newsletter are hereby expressly disclaimed. The content on this Newsletter is provided “as is;” no representations are made that the content is error-free.
No reader, user, or browser of this Newsletter should act or refrain from acting on the basis of information on this Newsletter without first seeking independent advice in that regard. Use of, and access to, this website or any of the links or resources contained within the site do not create an portfolio manager -client relationship between the reader, user, or browser and website authors, contributors and their respective employers. The views expressed at, or through, this site are those of the individual authors writing in their individual capacities only.
by Chirag Lodaya and Surbhi Soni
Executive Summary
Plastic Pipe is a highly fragmented industry with large number of unorganized players. Due to commoditized nature of the product and low capital requirement, there are optically no barriers to entry. Moreover, there is high dependence on imports as more than half of the raw-material requirement is sourced from outside India. Given this, plastic pipe industry might not seem lucrative to any first level thinker. However, our deep dive into the sector suggests otherwise and we were able to gather some differential insights about this business.
Plastic Pipe is a unique industry. It has grown at a healthy rate of 15% over the last 10 years and has been the fastest growing segment in the overall building materials space. Despite being a fragmented market, the competitive intensity in this industry is moderate. Unlike other building material categories like tiles and plywood, players in this industry compete on quality and not merely on price. In addition, there is increased consolidation benefitting larger (many of them listed) players. Despite a challenging year where global supply chains were disrupted, large players demonstrated agility and emerged stronger.
Two parts to our deep dive into Plastic Pipe sector to understand “Dhanda kaisa hai?”
1. Dhanda Kaise hota hai?
Evaluating various aspects such as raw-material sourcing, manufacturing process, distribution chain and unit economics of pipes and fittings.
2. Dhande mein kya ho raha hai?
Evaluating current trends and developments – imposition of ADD on CPVC resin, buzz around Jal-Jeevan Mission (hype or real potential) and most importantly what really is driving consolidation in the sector.
We believe the sector has long-term tailwinds and will have big winners. Our findings reinforce our bullish view on the sector.
DEEP DIVE INTO THE PLASTIC PIPE INDUSTRY
The plastic pipe industry has seen unprecedented PVC price rise due to disruption of global supply chains, container shortages and declaration of force-majeure by large resin manufacturers. PVC prices have more than doubled and continue northward. Unorganized players faced both availability and working capital constraints. This led to market share gains for organized players. With the buzz around real estate revival, government infrastructure push, and exit of some players, prospects for the industry look bright which is reflecting in a near-term strong performance by listed players.
In this note, we deep dive into the sector to get answers to two basic questions:
– Dhanda kaise hota hai? – Dhande mein kya ho raha hai?
Let’s start with the basics.
DHANDA KAISE HOTA HAI?
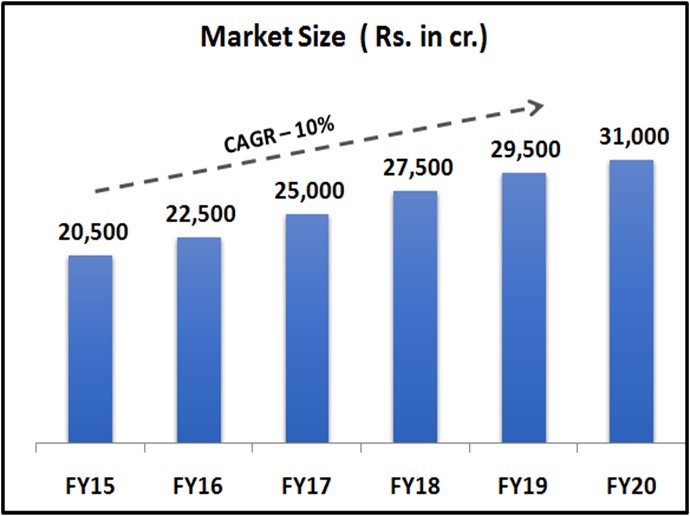
Plastic pipe industry in India
Source: Industry Reports
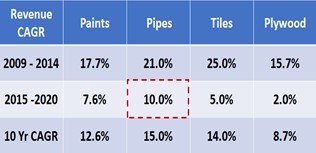
Plastic pipe is ~Rs. 31,000 cr. industry in India which has clocked a healthy growth rate of 15% over the last 10 years. As demonstrated above, it has outpaced other building material categories like tiles, paints and plywood and has been the fastest growing sector in the domestic building material space.
END-USER MIX
Source: Industry Reports
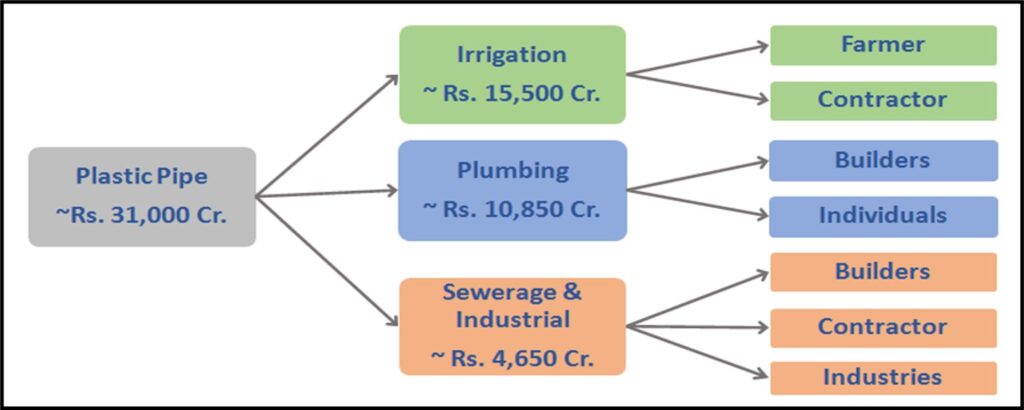
The growth in plastic pipe industry is led by multiple demand drivers. Irrigation accounts for highest share of the demand (~50%) followed by plumbing which accounts for ~35% of the total demand. Revival of real-estate sector and increased government focus on infrastructure development is likely to drive up demand from the plumbing segment. Other segments include sewerage which accounts for ~11-12% of the demand and the remaining ~3-4% of the demand comes from industrial applications.
Source: Industry Reports
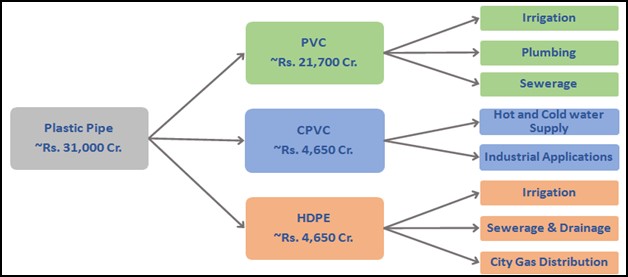
There are three main types of plastic pipes – PVC, CPVC and HDPE.
Polyvinyl Chloride (PVC) – PVC is the most commonly used polymer type and accounts for ~70% of the demand.
Chlorinated Polyvinyl Chloride (CPVC) – CPVC pipes are produced by chlorination of PVC resin. CPVC pipes can withstand higher temperature than standard PVC pipes and hence are suitable for hot and cold water application.
High Density Polyethylene (HDPE) – HDPE Pipes are softer and more flexible pipes. HDPE is more suitable for fluid and gas transportation.
DWC (Double Wall Corrugated) – DWC pipes are similar to HDPE pipes and are fast replacing traditional metal and cement pipes (RCC) due to longer life and low-maintenance requirement. DWC pipes are mainly used for underground drainage system in government and infrastructure projects. Amongst large players, Supreme Industries was the first company to put up DWC capacity in 2016. Prince Pipes added capacities of DWC in 2018 and in the same year, Astral also added the capacity by acquiring a private company – Rex Polyextrusion.
MANUFACTURING – PROCESS OF PIPES & FITTINGS
Process of manufacturing pipe is known as Extrusion. In this process, the PVC compound is fed into the hopper of an extruder machine where the compound is melted at high temperature and pressure. The molten plastic is passed through a die which provides a specific profile to it which is then cooled in a vacuum controlled water tank. The pipe is then pulled through a roller and cut into the desired length.
Fittings are specialized products that help in the installation of pipes. The process of making fittings is almost similar to that of pipe except that the molten plastic is fed into a mould where it is cooled and solidified into the shape of the mould.
COMPETITIVE LANDSCAPE
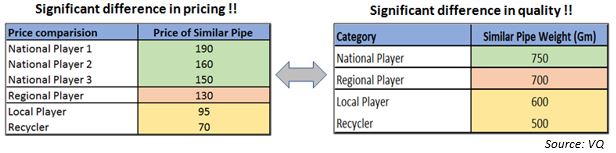
Source: VQ
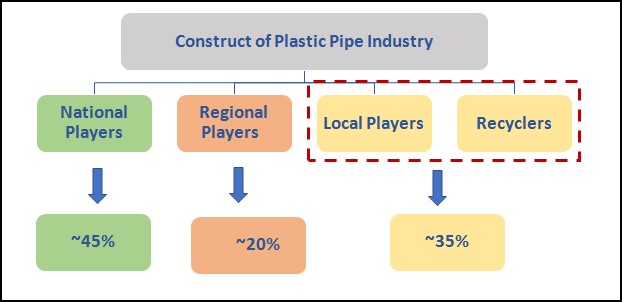
Domestic plastic pipe is a fragmented market with National Players, Regional Players and Local Players/ Recyclers. If we look at the construct of the industry, ~ 45% of the market lies with the top 6 national players. The next 20% of the market lies with ~15-20 dominant regional players and the rest~35% of the market lies with smaller unorganized players who are either local manufacturers or mere recyclers.
KEY PLAYERS IN THE INDUSTRY
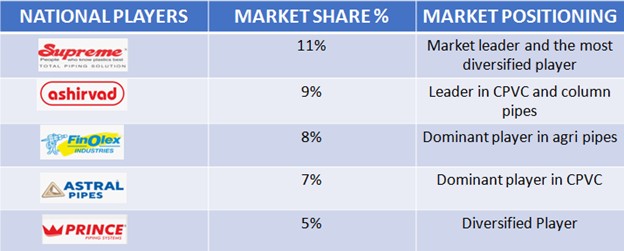
National players
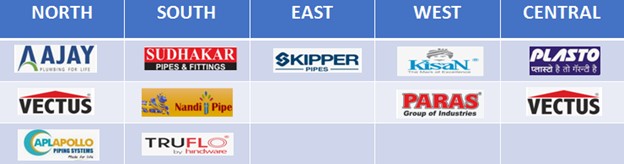
Regional players
(This is an illustrative list of the some of the dominant regional players)
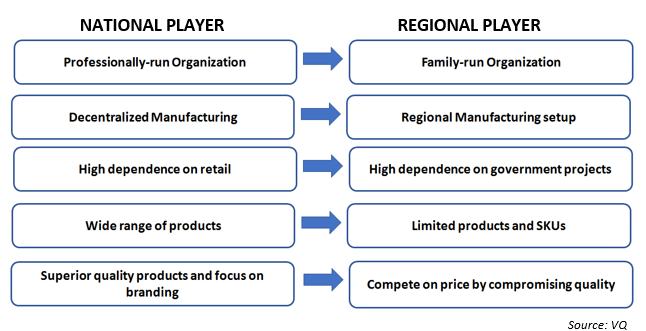
COMPARISON BETWEEN NATIONAL AND REGIONAL PLAYER
There are large number of local players and recyclers who account for ~35% of the total market. Our channel checks suggest that local players can charge much lower than national players by compromising on quality and cutting their manufacturing cost; Here’s how.
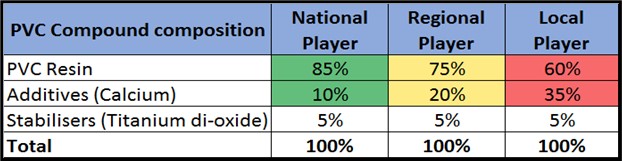
PVC compound which is 70-75% of COGS consists of resin, additives (calcium) and stabilizers (titanium di-oxide) which are required to be mixed in prescribed proportion to manufacture a pipe of a standard quality (Ideal proportion being 85:10:5). Additive (calcium) is 1/10th of resin cost. Local players manipulate the mix of PVC compound (60:35:5) to achieve low manufacturing cost.
However, they are not direct competition to large players. Pipes have a long replacement cycle and cost of replacement is extremely high as well. In other building material categories such as tiles and plywood, smaller players are competitive in terms of quality. In case of pipes, there is a noteworthy difference in quality and there is a brand value in the minds of consumers.
For example – For a pipe having weight of 750 gm, the price differential amongst the national players is insignificant to influence the purchase decision of a consumer as pipe is a small % of the total project cost. On the other hand, though a local player/recycler can offer the cheapest price but that comes at the cost of quality (500 gm vs 750gm) which is not acceptable. Hence, a price conscious customer may compromise a bit on quality (700 vs 750 gm) and shift to a regional player, but it is highly unlikely that he would move to a local player/recycler irrespective of how cheap the price is.
This means that due to significant difference in pricing as well as quality, by offering cheaper price local players do not pose any threat to national players. Hence, in our view the competition for a national player is restricted to another national player or a dominant regional player.
RAW – MATERIAL SOURCING
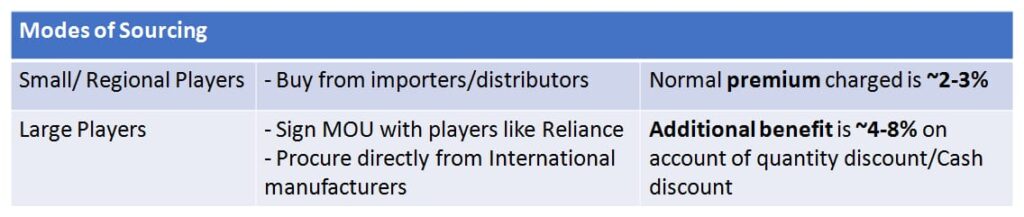
Raw-material for plastic pipe i.e., PVC resin and additives together account ~70-75% of the total COGS. In India, ~ 56% of the total demand of PVC resin is met through imports. There are limited domestic resin suppliers. One of the largest domestic resin suppliers is Reliance.
Large players have sourcing advantages as demonstrated below:
Unlike large players who enjoy 4-8% discount by procuring resin from Reliance or by directly importing from international resin manufacturers, small players procure resin from importers or distributors by paying a premium of 2-3%. Due to this, large players enjoy a cost advantage of 6-11% over small players. Small / regional players try to eliminate this differential by manipulating the mix of PVC compound!
As per our channel checks the recent rally in PVC prices has led to dual problems for smaller players – sourcing challenges (availability issues) and increased premium (north of 10%). Several players are facing existential crises.
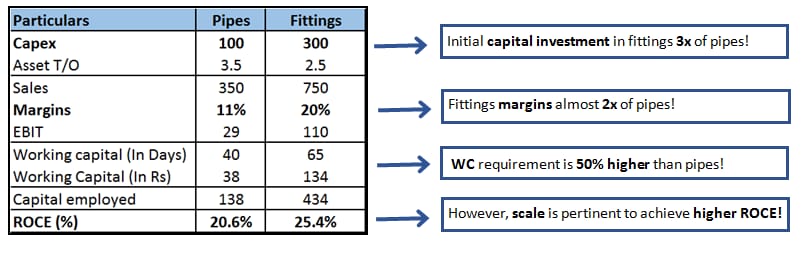
UNIT ECONOMICS
Manufacturing pipes is simple and not very capital intensive, but fittings are different. Fittings require precision and significant investment in moulds which makes it capital intensive compared to pipes (~3x of pipes). The requirement to maintain large number of SKUs also increases the working capital in fittings. On the other hand, pipe is a fast-moving product and have higher asset turns compared to fittings. However, due to its specialized nature, fittings fetch much higher margin than pipes (~2x of pipes).
To summarize, both pipes and fittings are profitable businesses. In our view, higher share of fittings differentiates a company from its competition as it helps them to sell more volumes of pipes. And, a company can also earn Higher ROCEs provided scale is achieved.
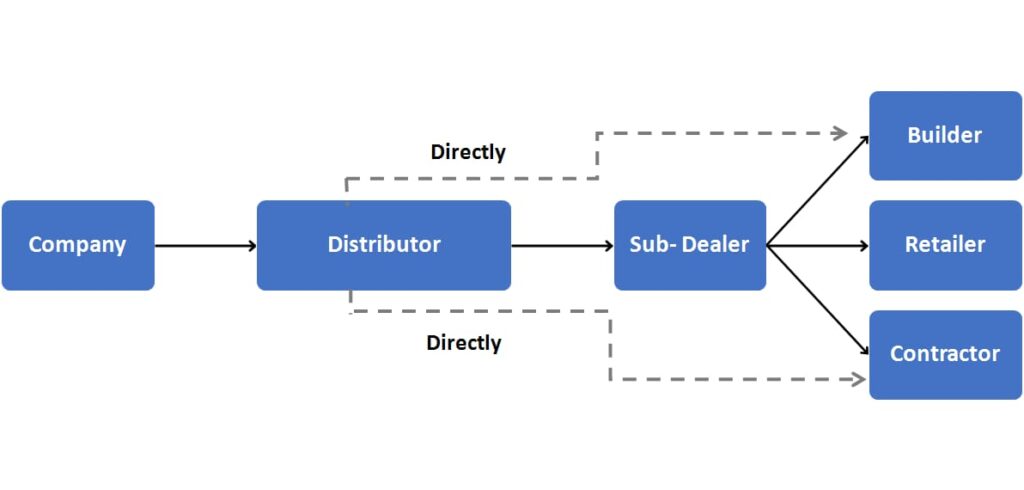
DISTRIBUTION CHAIN
The distribution chain of pipe is unique. Due to voluminous nature of the product, pipe industry follows a two-tier structure. Companies sell pipes to their exclusive distributors who either sell to a sub-dealer or directly to end customer. In the entire distribution chain, the distributor is the king. As distributors have the power to influence a consumer’s purchase decision, companies’ ability to scale depends on – 1) the distributor’s network and reach and 2) the relationship of the company with the distributor.
Note: Unlike pipes, in other building material categories like tiles, plywood, and wires, there are no company-exclusive distributors. The companies directly sell to the dealers who are also the retailers.
PIPE – A BUSINESS OF SCALE
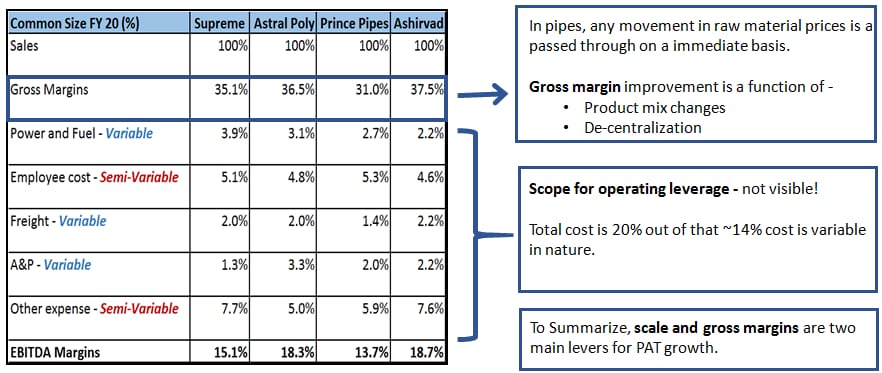
The common size analysis shows that pipe is a low value addition product as COGS itself is 65-70% of the sales. Pipe is a pass-through industry where any increase/decrease in raw-material price is passed on to the consumer on immediate basis. Also, majority of the other costs are variable/semi-variable in nature leaving marginal scope for operating leverage.
In this business scale and gross margin improvement are the only two key drivers for profitability growth. Gross margin is a function of change in product mix and manufacturing de-centralization. Let’s understand both the aspects in detail.
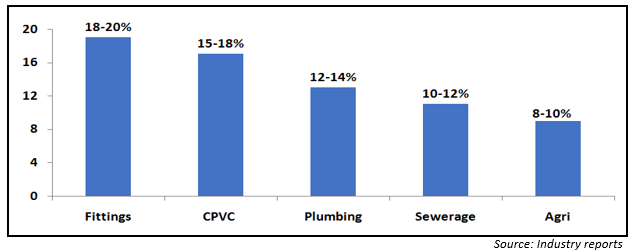
UNDERSTANDING OPERATING PROFITABILITY OF DIFFERENT SUB-SEGMENT/CATEGORIES
ndustry data suggests that there is striking difference in margins earned under each segment. Due to their specialized nature, fittings and CPVC fetch higher margins compared to other categories. Similarly, because of higher competition, companies earn lower margins in agri compared to plumbing and sewerage. Therefore, profitability of a company depends on its product profile and the segment it caters to.
HOW DECENTRALIZATION HELPS IN IMPROVING PROFITABILITY?
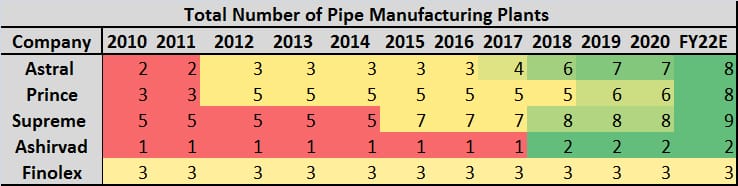
As pipe is a voluminous product, decentralization helps companies to reduce their freight cost and improve realization. In addition to reduced cost, strategic location improves their competitiveness with regional players and enhances their market-serviceability. We noticed that in last 5 years, large players have accelerated expansion and decentralized their business operations.
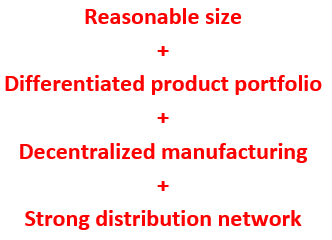
To conclude, we believe that these four attributes give a company competitive advantage over peers.
DHANDE MEIN KYA HO RAHA HAI?
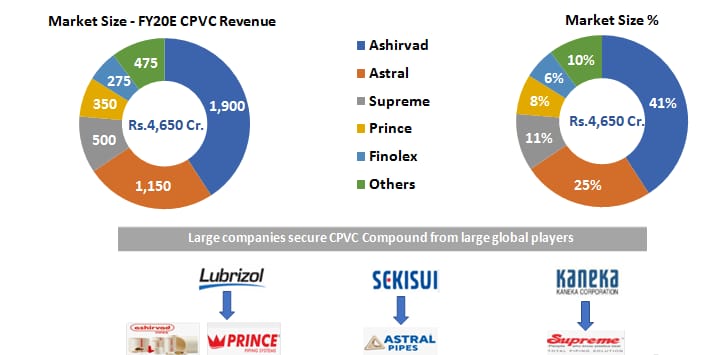
ANTI- DUMPING DUTY (ADD) ON CPVC – A BOON FOR ORGANIZED PLAYERS
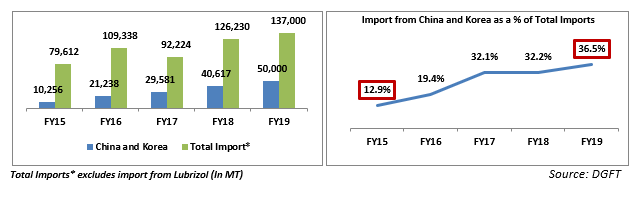
In India, CPVC is ~ Rs. 4,650 cr. market. Due to increased acceptability and application, the consumption of CPVC has gone up and it has become the fastest growing category within plastic pipes. Currently, India does not have CPVC capacities, and it meets ~95%+ of its compound requirement through imports. Large players procure CPVC compound from global manufacturers whereas China and South Korea were key source of CPVC compound for small unorganized players. Small players sourced cheaper resin from these countries and competed aggressively with large players on price. In a span of just 4 years share of imports from these countries had gone up 3 times from ~13% to 36%.
In order to curb import of cheaper compound, in February 2020, GOI imposed ADD on CPVC resin imported from China and South Korea. Due to this ~40% of imports have become unviable. This move has taken away the advantage of sourcing cheaper resin from smaller players and has made large players even more competitive.
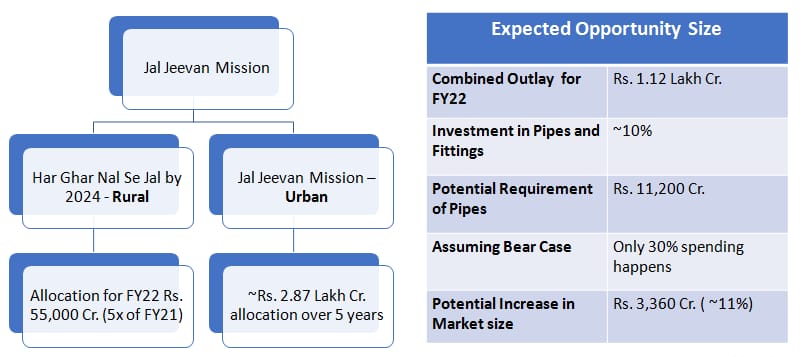
THE BUZZ AROUND JAL JEEVAN MISSION
In the Feb’21 budget, GOI merged the ongoing National Rural Drinking Water Programme (NRDWP) into Jal Jeevan Mission with an aim to provide tap connections to every rural household by 2024. What caught everyone’s attention was the massive allocation of Rs. 55,000 cr. towards this mission (5 times the allocation of FY21!!). In addition to this, the Government also announced Jal Jeevan Urban mission which aims to provide water supply through functional taps in 4,378 statutory towns and sewerage management in 500 AMRUT cities. These two missions (rural + urban) combined mean that plastic pipes worth Rs. 11,200 cr would be required. In a typical water supply project, generally HDPE and PVC pipes are required for last mile supply of water from distribution point to households. If the execution is right then undoubtedly, this creates an exciting opportunity for HDPE and PVC pipes.
Types of pipe required in a water supply projects
However, historically, government projects have attracted regional players and there has not been any active participation from any of the national players. Further, government projects have lower margins and are working capital intensive. Then, why are we even seeing so much bullishness from large players?
Because this time, it is possibly different!
Post- covid, a lot of regional players have moved out of the market as they faced severe challenges in sourcing raw material. Large players are willing to capitalize on this and they believe due to better manufacturing and distribution network, government tenders are more likely to flow to them. One of the large companies has already announced investments focused on Nal se Jal scheme, the other has talked about adding HDPE capacities. Thus, unlike past, we may see large players actively participating in the Jal Jeevan Mission.
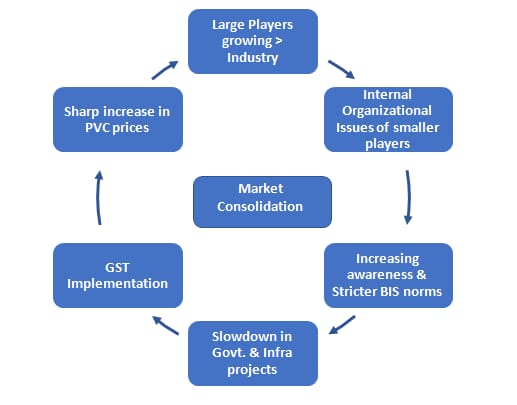
SECTOR CONSOLIDATION
There are multiple tailwinds driving industry consolidation. Last five year data clearly shows the trend.
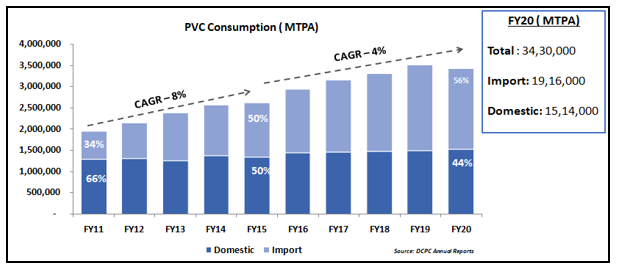
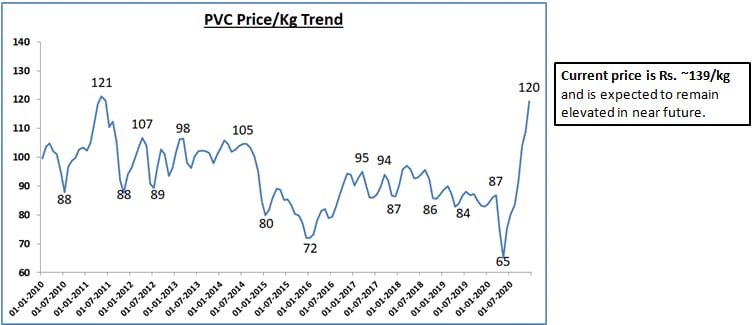
PVC CONSUMPTION – GREW AT A SLOWER PACE
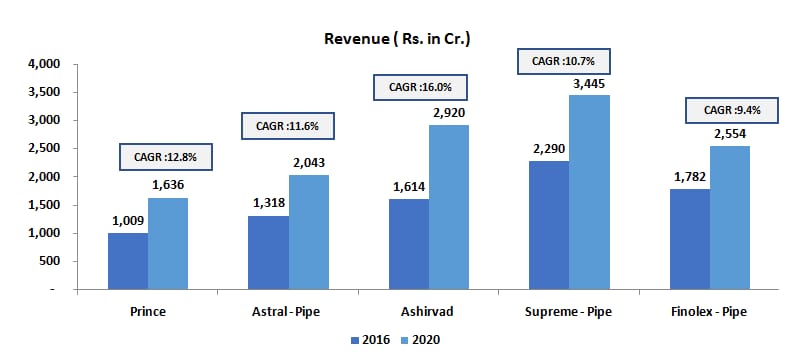
ORGANIZED PLAYERS GREW AT DOUBLE DIGIT RATE
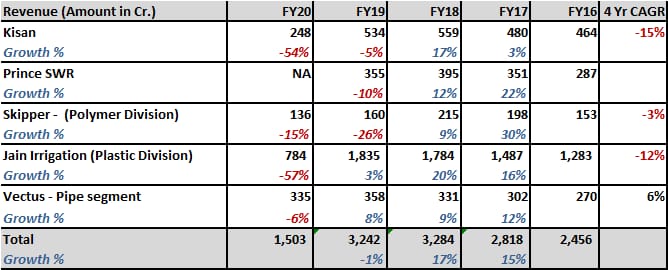
REGIONAL PLAYERS – STRUGGLED TO GROW
As can be seen above, in the last 5 years, PVC consumption in India grew at a much slower rate compared to the previous block of 5 years. During the same period, despite a slow-down in PVC consumption, large players have grown at a much healthier rate whereas small/regional players have struggled big time. This means that large players have not only surpassed the industry growth rate but have also grabbed the market share from smaller players.
This has been driven by –
PVC prices have breached all-time highs. The recent rally in PVC prices has aggravated the struggle of small players. Sourcing challenges have moved many small players out of the market. Large players who have secure supplies have not faced any severe disruption yet and have been able to pass on the price rise.
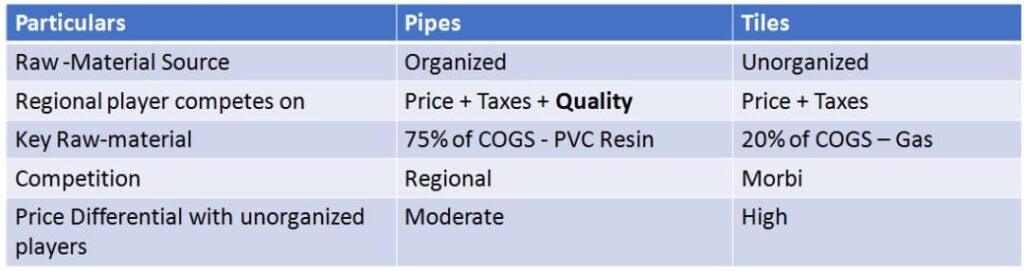
(b) GOODS AND SERVICES TAX (GST)
The above example of comparison with tiles confirms that scope of tax evasion in pipes is far lesser than other segments like tiles given than 75% of COGS is tax paid.
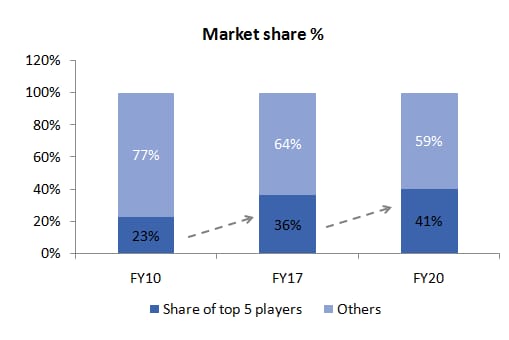
Industry data confirms the consolidation thesis. The share of top 5 players has doubled in the last 10 years.
CONCLUSION
After a comprehensive study of the industry, analysis of various aspects of the business and given the recent trends in sector it is evident that plastic pipe is the fastest growing segment in overall building material space with huge runway for growth. Industry is consolidating and larger players continue to see good times. Though it looks like a simple business at first glance, it is not easy to scale which is a key requirement for good profitability.
We believe the sector has long term tailwinds and will have big winners. Our findings reinforce our bullish view on the sector.
Please read the following carefully and select your residency jurisdiction
*If you access this website by giving false declaration, you shall be solely liable/responsible for any adverse consequences suffered, legally as well as financially, pursuant to use of any information contained in this website.